

Relationship between lymphocyte-related parameters and the prognosis of patients with lupus nephritis
- PMID: 40698075
- PMCID: PMC12280367
- DOI: 10.3389/fimmu.2025.1613483
Relationship between lymphocyte-related parameters and the prognosis of patients with lupus nephritis
Abstract
Background: The occurrence of lupus nephritis is primarily caused by the dysfunction of the autoimmune system, leading to the deposition of immune complexes (ICs) in the kidneys and associated inflammatory responses. Lymphocyte-related parameters, including the platelet to lymphocyte ratio (PLR), neutrophil to lymphocyte ratio (NLR), and monocyte to lymphocyte ratio (MLR), have been confirmed in recent years as important novel indicators for several inflammatory diseases. However, it remains unclear whether lymphocyte-related parameters can serve as prognostic indicators for lupus nephritis (LN).
Methods: This study included a total of 143 LN patients, who were divided into several groups based on the optimal cutoff values of lymphocyte-related parameters. The primary endpoint was poor renal prognosis, and the patients' prognosis was monitored through follow-up, recording the time at which patients reached the study endpoint. The predictive effect was evaluated using the area under the receiver operating characteristic curve (AUROC), Kaplan-Meier (K-M) curves, and Cox proportional hazards analysis.
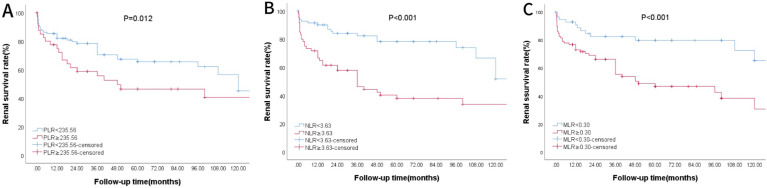
Results: Compared with the healthy control group, the PLR, NLR, and MLR levels in the LN group were significantly higher (P < 0.05). Kaplan-Meier survival analysis showed that patients with high PLR, NLR, and MLR had poorer prognosis (P < 0.05). Univariate Cox regression analysis indicated that PLR (HR 1.002, 95% CI 1.000-1.004, P = 0.05) and NLR (HR 1.081, 95% CI 1.031-1.134, P = 0.001) were associated with kidney progression. Multivariate Cox regression analysis showed that only MLR (HR 5.861, 95% CI 1.515-22.665, P = 0.010) was an independent risk factor affecting the renal prognosis of LN patients, whereas PLR and NLR were not. Based on the cutoff value of MLR, patients were divided into two groups. In terms of general data, the high MLR group had a significantly higher mean arterial pressure compared to the low MLR group (P = 0.002). In terms of laboratory tests, the high MLR group had a significantly lower eGFR compared to the low MLR group (P = 0.001). In terms of renal pathology, the high MLR group showed statistically significant differences compared to the low MLR group in AI index, CI index, capillary endothelial cell proliferation, cellular/fibrous crescent formation, and interstitial inflammatory cell infiltration (P < 0.05).
Conclusion: MLR may serve as an independent risk factor for poor renal prognosis in SLE patients.
Keywords: lupus nephritis; monocyte to lymphocyte ratio; neutrophil to lymphocyte ratio; platelet to lymphocyte ratio; prognosis; retrospective cohort study.
Copyright © 2025 Qi, Zhu, Bai, Luo and Luo.
Conflict of interest statement
The authors declare that the research was conducted in the absence of any commercial or financial relationships that could be construed as a potential conflict of interest.
Figures


References
-
- Tudurachi BS, Anghel L, Tudurachi A, Sascău RA, Stătescu C. Assessment of inflammatory hematological ratios (Nlr, plr, mlr, lmr and monocyte/hdl-cholesterol ratio) in acute myocardial infarction and particularities in young patients. Int J Mol Sci. (2023) 24(18):14378. doi: 10.3390/ijms241814378, PMID: - DOI - PMC - PubMed
MeSH terms
Substances
LinkOut - more resources
Full Text Sources
Research Materials
Miscellaneous