

Progression to fibrosis and hepatocellular carcinoma in DEN CCl4 liver mice, is associated with macrophage and striking regulatory T cells infiltration
- PMID: 40698077
- PMCID: PMC12279789
- DOI: 10.3389/fimmu.2025.1601215
Progression to fibrosis and hepatocellular carcinoma in DEN CCl4 liver mice, is associated with macrophage and striking regulatory T cells infiltration
Abstract
Background and aim: Hepatocellular carcinoma (HCC) is a classic inflammation related cancer with most cases arising from chronic liver disease (CLD). This study investigates immune dysregulation that occurs during the progression of CLD to HCC by delineating changes in immune cell composition and distribution within the liver microenvironment.
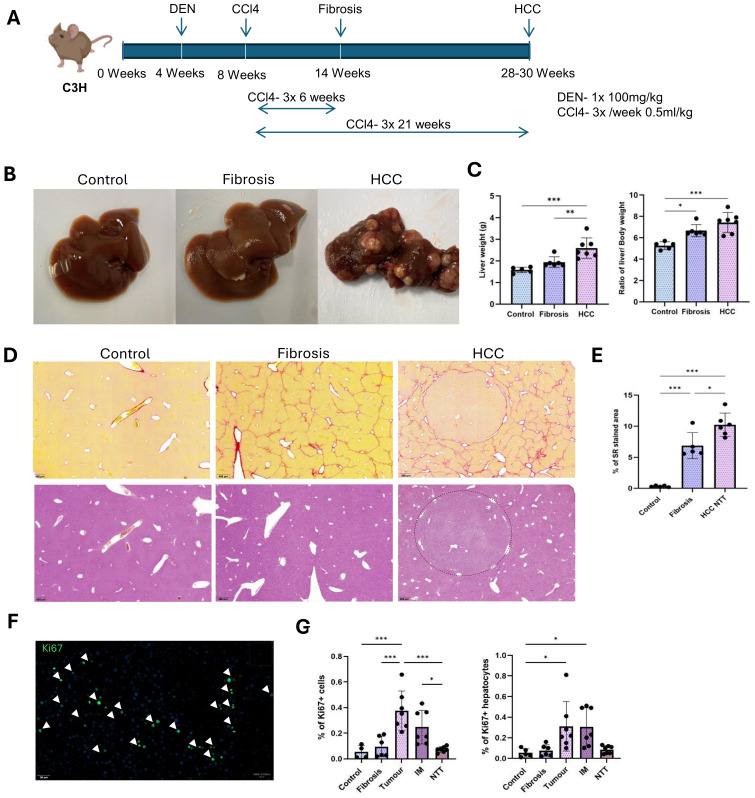
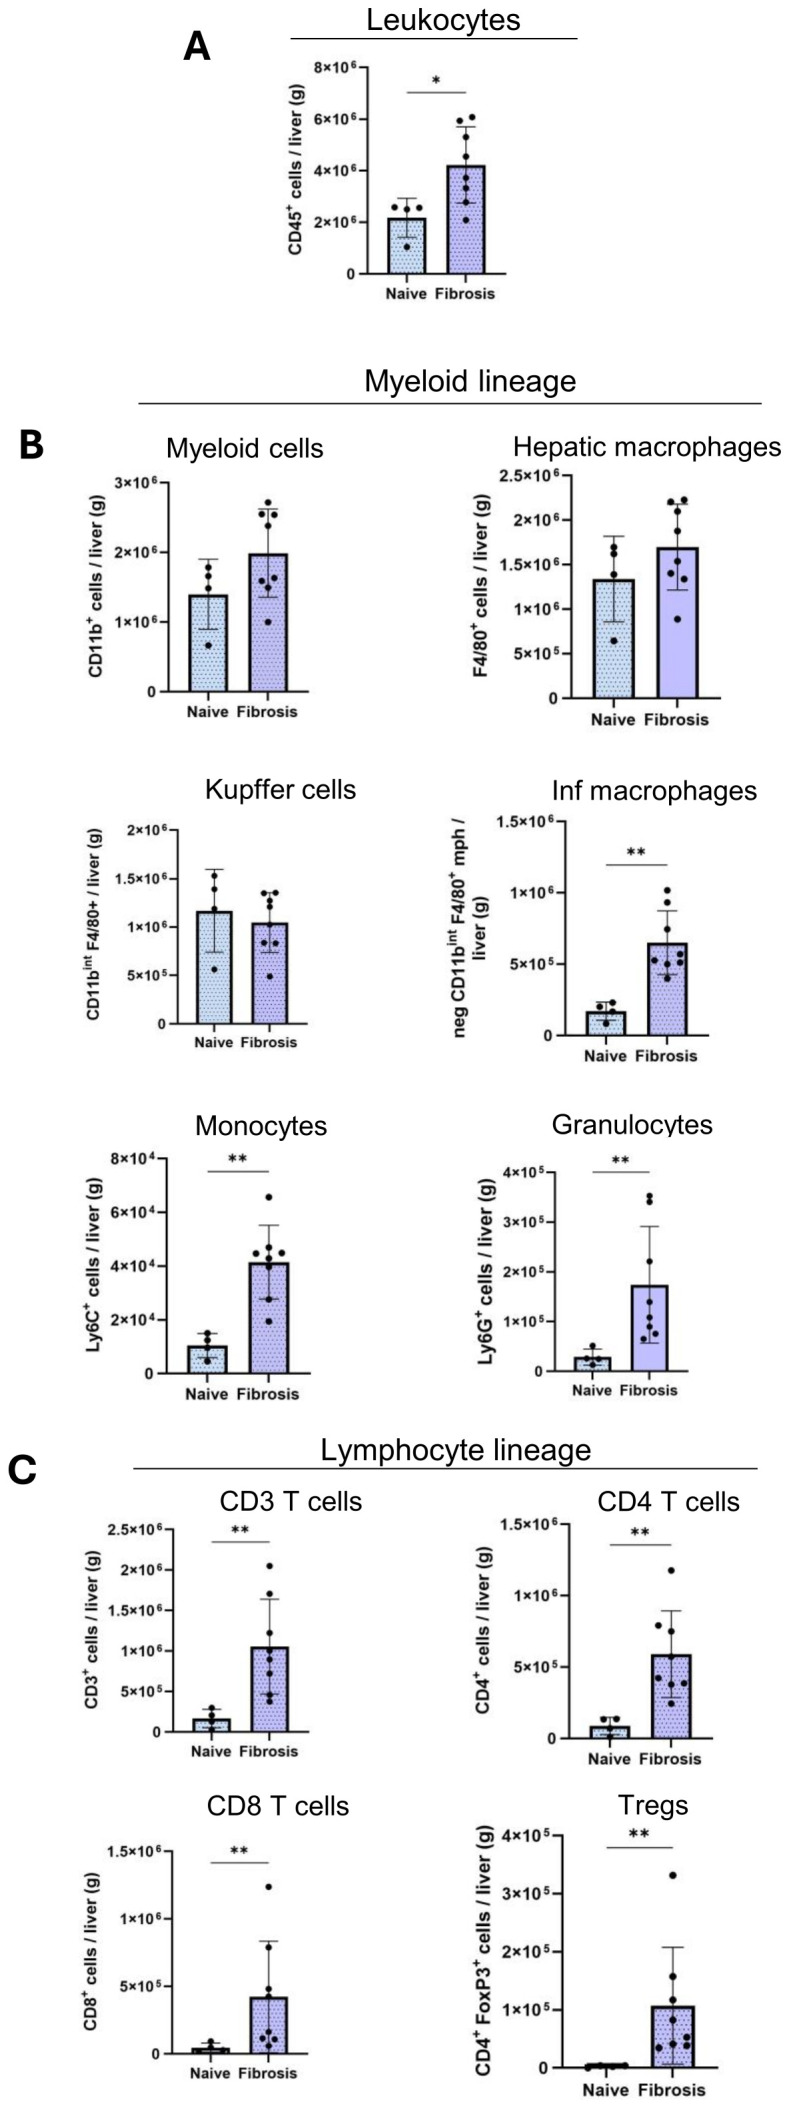
Methods: Mice were injected with Diethylnitrosamine (DEN) at 4 weeks of age, followed by continuous tri-weekly injections of carbon tetrachloride (CCl4) for 6 and 21 weeks to induce liver fibrosis and HCC. Naïve and Phosphate-buffered saline (PBS) corn oil treated mice were used as controls. Immune cell profiling was performed using multiplex immunofluorescence and flow cytometry analyses.
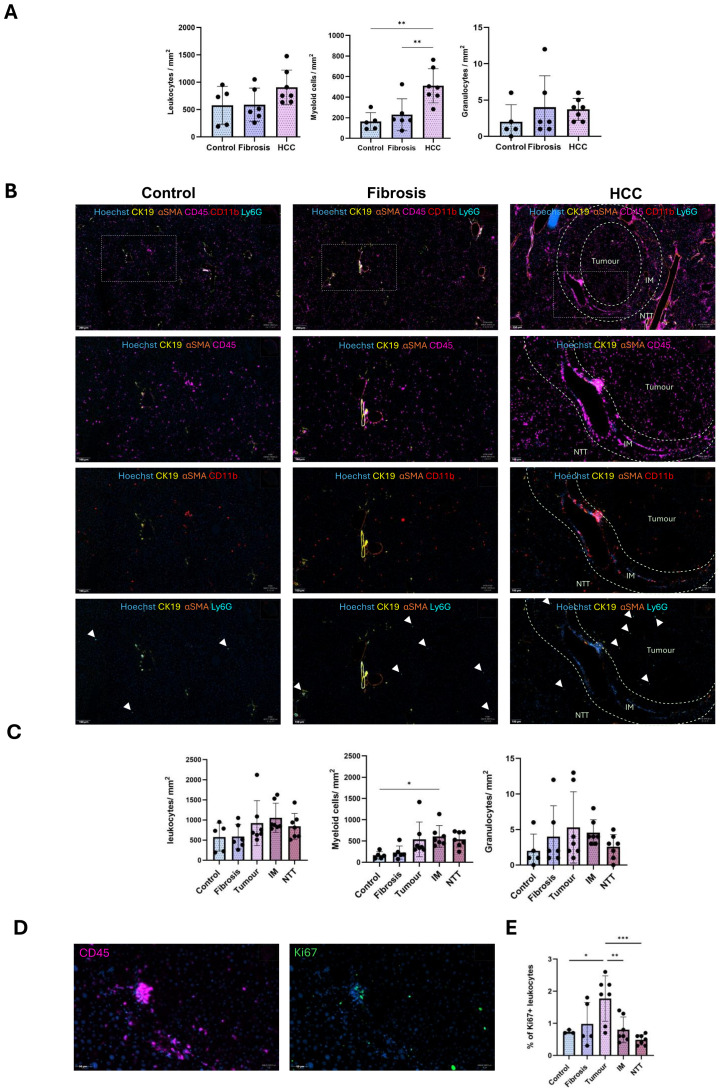
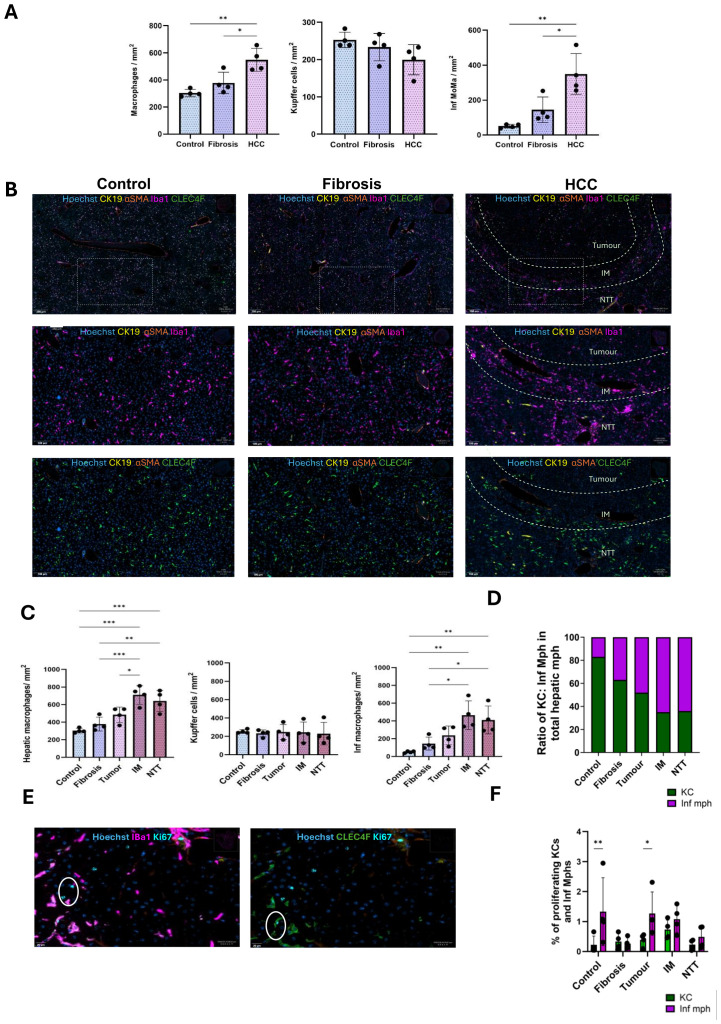
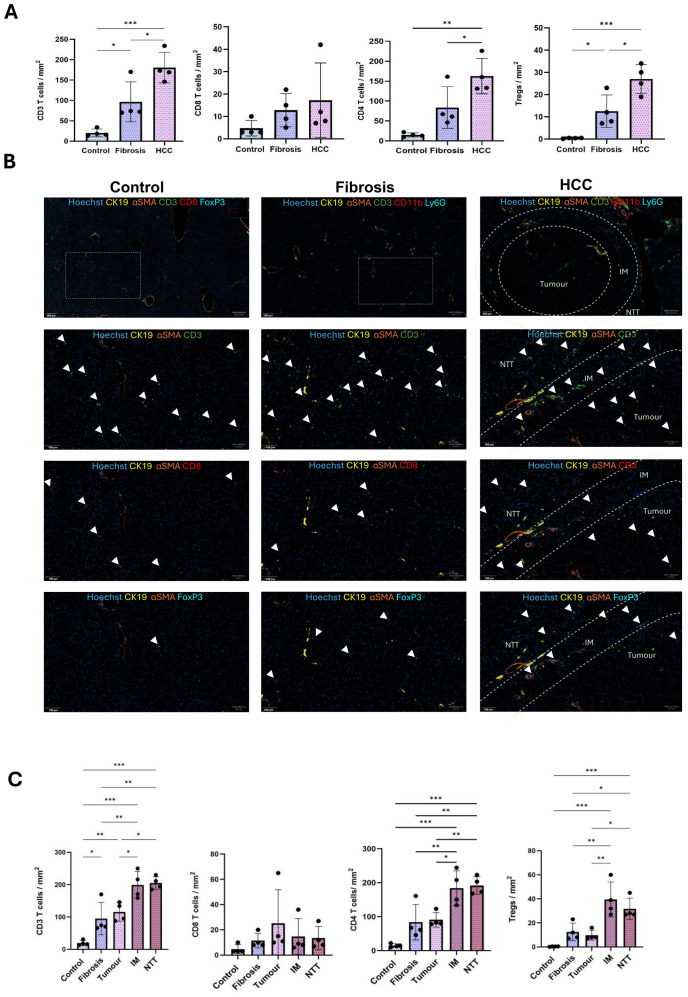
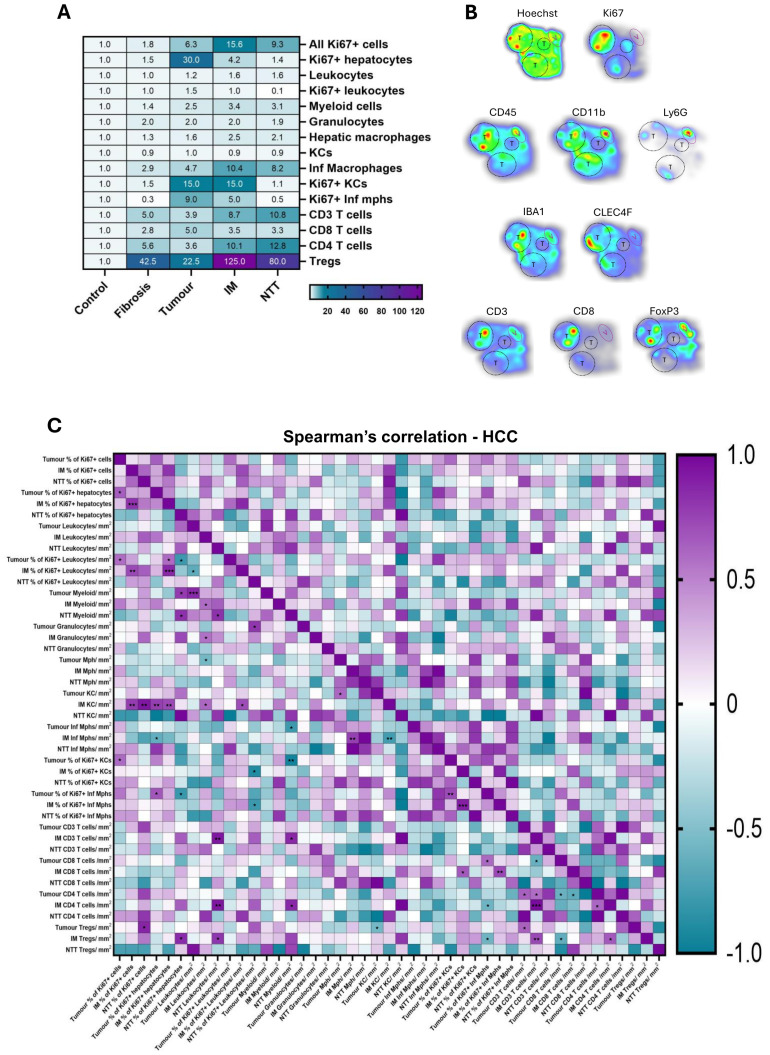
Results: The spatial analysis of immune cell populations in HCC reveals stable leukocytes overall, with notable increases in myeloid cells, particularly infiltrating macrophages (Inf mph). Indeed, Inf mph show a progressive enrichment from control to tumor, reaching a 5-fold and 10-fold increase in the invasive margin (IM) and surrounding non-tumor tissue (NTT) regions, respectively. T lymphocytes, especially CD4+ T cells but not CD8+ T cells, significantly expand, with CD4+ cells increasing up to 10-fold in the IM and NTT regions of HCC livers. Regulatory T cells (Tregs) population exhibits an extraordinary 125-fold and 80-fold surge in the IM and NTT regions, respectively.
Conclusions: The DEN-CCl4 induced HCC mouse model replicates key immunosuppressive features of human HCC, notably increased Tregs and macrophages, which provides a robust platform for testing immunotherapies. The prominence of immune cells in the IM region underscores its importance as a critical interface modulating tumor-immune interactions, while the elevated immune presence in the NTT region reflects broader immune dysregulation associated with advanced CLD, and potentially facilitating tumor progression.
Keywords: flow cytometry; hepatocellular carcinoma; immune cells; liver; liver fibrosis; multiplex immunofluorescence.
Copyright © 2025 Ajith, Evraerts, Bouzin, Brusa, Merimi, Najar, Smets, Sokal and Najimi.
Conflict of interest statement
The authors declare that the research was conducted in the absence of any commercial or financial relationships that could be construed as a potential conflict of interest.
Figures
Similar articles
-
Tumor-Associated Neutrophils Recruit Macrophages and T-Regulatory Cells to Promote Progression of Hepatocellular Carcinoma and Resistance to Sorafenib.Gastroenterology. 2016 Jun;150(7):1646-1658.e17. doi: 10.1053/j.gastro.2016.02.040. Epub 2016 Feb 26. Gastroenterology. 2016. PMID: 26924089
-
Liver fibrosis promotes immune escape in hepatocellular carcinoma via GOLM1-mediated PD-L1 upregulation.Cancer Lett. 2021 Aug 10;513:14-25. doi: 10.1016/j.canlet.2021.05.007. Epub 2021 May 14. Cancer Lett. 2021. PMID: 33992711
-
Hepatic inflammation-fibrosis-cancer axis in the rat hepatocellular carcinoma induced by diethylnitrosamine.J Cancer Res Clin Oncol. 2017 May;143(5):821-834. doi: 10.1007/s00432-017-2364-z. Epub 2017 Feb 25. J Cancer Res Clin Oncol. 2017. PMID: 28238064 Free PMC article.
-
Adefovir dipivoxil and pegylated interferon alfa-2a for the treatment of chronic hepatitis B: a systematic review and economic evaluation.Health Technol Assess. 2006 Aug;10(28):iii-iv, xi-xiv, 1-183. doi: 10.3310/hta10280. Health Technol Assess. 2006. PMID: 16904047
-
Contrast-enhanced ultrasound using SonoVue® (sulphur hexafluoride microbubbles) compared with contrast-enhanced computed tomography and contrast-enhanced magnetic resonance imaging for the characterisation of focal liver lesions and detection of liver metastases: a systematic review and cost-effectiveness analysis.Health Technol Assess. 2013 Apr;17(16):1-243. doi: 10.3310/hta17160. Health Technol Assess. 2013. PMID: 23611316 Free PMC article.
References
-
- International Agency for Research on Cancer . Cancer today: Globocan 2022 (version 1.1) - 08.02.2024. Global Cancer Observatory; (2024). Available at: https://gco.iarc.who.int (Accessed January 24, 2025).
-
- Degroote H, Lefere S, Vandierendonck A, Vanderborght B, Meese T, Van Nieuwerburgh F, et al. Characterization of the inflammatory microenvironment and hepatic macrophage subsets in experimental hepatocellular carcinoma models. Oncotarget. (2021) 12:562. doi: 10.18632/oncotarget.27906, PMID: - DOI - PMC - PubMed
-
- Bengtsson B, Widman L, Wahlin S, Stål P, Björkström NK, Hagström H. The risk of hepatocellular carcinoma in cirrhosis differs by etiology, age and sex: A Swedish nationwide population-based cohort study. United Eur Gastroenterol J. (2022) 10:465–76. doi: 10.1002/ueg2.12238, PMID: - DOI - PMC - PubMed
-
- Sharma A, Nagalli S. Chronic liver disease. In: StatPearls. StatPearls Publishing, Treasure Island, FL: (2023). - PubMed
MeSH terms
Substances
LinkOut - more resources
Full Text Sources
Medical
Research Materials