. 2025 Apr-Jun;69(2):235-242.
doi: 10.22336/rjo.2025.37.

Retinal Vascular Diseases Highlighted by Adaptive Optics Ophthalmoscopy

Affiliations

Retinal Vascular Diseases Highlighted by Adaptive Optics Ophthalmoscopy

Andrada-Elena Mirescu et al. Rom J Ophthalmol. 2025 Apr-Jun.

Abstract

Objective: Our objective was to assess retinal microcirculation and photoreceptor parameters in both healthy individuals and patients with vascular retinal diseases using adaptive optics ophthalmoscopy. This technology enhances optical system resolution to 2 µm by correcting wavefront aberrations, revolutionizing in vivo studies of ocular structures.

Materials and methods: Our study examined the clinical applications of adaptive optics in both healthy individuals and patients with vascular retinal diseases, including nonproliferative diabetic retinopathy, proliferative diabetic retinopathy, and macular telangiectasia (MacTel) type 2.

Results: In our study, we observed a higher wall-to-lumen ratio (WLR) value in our patient with proliferative diabetic retinopathy compared to our healthy volunteer. Additionally, we found a positive correlation between WLR and the severity of diabetic retinopathy. Furthermore, cone density was lower in all quadrants of our patient with proliferative diabetic retinopathy. For our patient diagnosed with MacTel type 2, the cone mosaic appeared irregular and blurred, with notable cone loss, especially on the temporal side of the macula, consistent with the typical location of MacTel type 2 lesions.

Discussion: Adaptive optics imaging assesses retinal changes in vascular diseases despite acquisition challenges. The obtained images aid in tracking the progression of diabetic retinopathy and detecting early changes of MacTel Type 2. Our study highlights both vascular and photoreceptor changes, quantifying these parameters to enhance the understanding of these vascular diseases.

Conclusions: Adaptive optics imaging is an advanced technique that provides high-resolution visualization of the microstructure of retinal vasculature and photoreceptors. This technology enhances our understanding of both healthy and vascular retinal conditions, aiding in diagnosis, monitoring, and prognosis.

Keywords: AO = adaptive optics; BCVA = best corrected visual acuity; DR = diabetic retinopathy; FC = fundus cameras; LD = lumen diameter; MacTel = macular telangiectasia; OCT = optical coherence tomography; ROI = regions of interest; SHWS = Shack-Hartmann wavefront sensor; SLO = scanning laser ophthalmoscopy; TD = total vessel diameter; WCSA = wall cross-sectional area; WLR = wall-to-lumen ratio; WT = wall thickness; adaptive optics; retinal vascular diseases.


Conflict of interest statement

The authors declare that they have no conflict of interest.

Figures
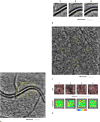
Fig. 1
Fig. 1
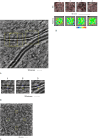
Adaptive optics imaging in a healthy volunteer patient. A. Image of the retinal arteriole obtained using an adaptive optics camera, measured in three different regions of interest (highlighted by yellow squares in the image); B. The three regions of interest were analyzed separately; C. Image of the cone mosaic obtained using an adaptive optics camera, measured in four different regions of interest (highlighted by yellow squares in the image): superior (first), nasal (second), inferior (third), and temporal (fourth); D. Red squares correspond to the identified cones, showing the cones in all four regions of interest (top image). Voronoi diagrams of all four regions of interest, illustrating the cone regularity index (bottom image)
Fig. 2
Fig. 2
Adaptive optics imaging in a nonproliferative diabetic patient. A. Image of the retinal arteriole obtained using an adaptive optics camera, measured in three different regions of interest (highlighted by yellow squares in the image); B. The three regions of interest were analyzed separately; C. Image of the cone mosaic obtained using an adaptive optics camera, measured in four different regions of interest (highlighted by yellow squares in the image): superior (first), temporal (second), inferior (third), and nasal (fourth); D. Red squares correspond to the identified cones, showing the cones in all four regions of interest (top image). Voronoi diagrams of all four regions of interest, illustrating the cone regularity index (bottom image)
Fig. 3
Fig. 3
Adaptive optics imaging in a proliferative diabetic patient. A. Image of the retinal arteriole obtained using an adaptive optics camera, measured in three different regions of interest (highlighted by yellow squares in the image); B. The three regions of interest were analyzed separately; C. Image of the cone mosaic obtained using an adaptive optics camera, measured in four different regions of interest (highlighted by yellow squares in the image): superior (first), temporal (second), inferior (third), and nasal (fourth); D. Red squares correspond to the identified cones, showing the cones in all four regions of interest (top image). Voronoi diagrams of all four regions of interest, illustrating the cone regularity index (bottom image)
Fig. 4
Fig. 4
Adaptive optics imaging in a patient with macular telangiectasia type 2. A. Image of the retinal arteriole obtained using an adaptive optics camera, measured in three different regions of interest (highlighted by yellow squares in the image); B. The three regions of interest were analyzed separately; C. Image of the cone mosaic obtained using an adaptive optics camera, measured in four different regions of interest (highlighted by yellow squares in the image): superior (first), temporal (second), inferior (third), and nasal (fourth); D. Red squares correspond to the identified cones, showing the cones in all four regions of interest (top image). Voronoi diagrams of all four regions of interest, illustrating the cone regularity index (bottom image)

References

    1. Szewczuk A, Zaleska-Żmijewska A, Dziedziak J, Szaflik JP. Clinical Application of Adaptive Optics Imaging in Diagnosis, Management, and Monitoring of Ophthalmological Diseases: A Narrative Review. Med Sci Monit. 2023;29:e941926. - PMC - PubMed
    1. Akyol E, Hagag AM, Sivaprasad S, Lotery AJ. Adaptive optics: principles and applications in ophthalmology. Eye (Lond) 2021;35(1):244–64. - PMC - PubMed
    1. Hampson KM, Turcotte R, Miller DT, Kurokawa K, Males JR, Ji N, Booth MJ. Adaptive optics for high-resolution imaging. Nat Rev Methods Primers. 2021;1:68. doi: 10.1038/s43586-021-00066-7. Epub 2021 Oct 14 PMCID: PMC8892592. - DOI - PMC - PubMed
    1. Lombardo M, Serrao S, Devaney N, Parravano M, Lombardo G. Adaptive optics technology for high-resolution retinal imaging. Sensors (Basel) 2012;13(1):334–66. - PMC - PubMed
    1. Burns SA, Elsner AE, Sapoznik KA, Warner RL, Gast TJ. Adaptive optics imaging of the human retina. Prog Retin Eye Res. 2019;68:1–30. - PMC - PubMed

LinkOut - more resources