. 2025 Jul 18:20:2525-2537.
doi: 10.2147/COPD.S524723. eCollection 2025.

Upregulation of ARHGAP18 by miR-613 Inhibits Cigarette Smoke Extract-Induced Apoptosis and Epithelial-Mesenchymal Transition in Bronchial Epithelial Cells

Affiliations

Upregulation of ARHGAP18 by miR-613 Inhibits Cigarette Smoke Extract-Induced Apoptosis and Epithelial-Mesenchymal Transition in Bronchial Epithelial Cells

Haifan Fu et al. Int J Chron Obstruct Pulmon Dis. .

Abstract

Objective: Chronic Obstructive Pulmonary Disease (COPD) is a major chronic respiratory disease affecting human health worldwide. However, there is still a lack of effective drugs for treating COPD. This study is intended to explore the function and molecular mechanism of ARHGAP18 and miR-613 in COPD pathogenesis.

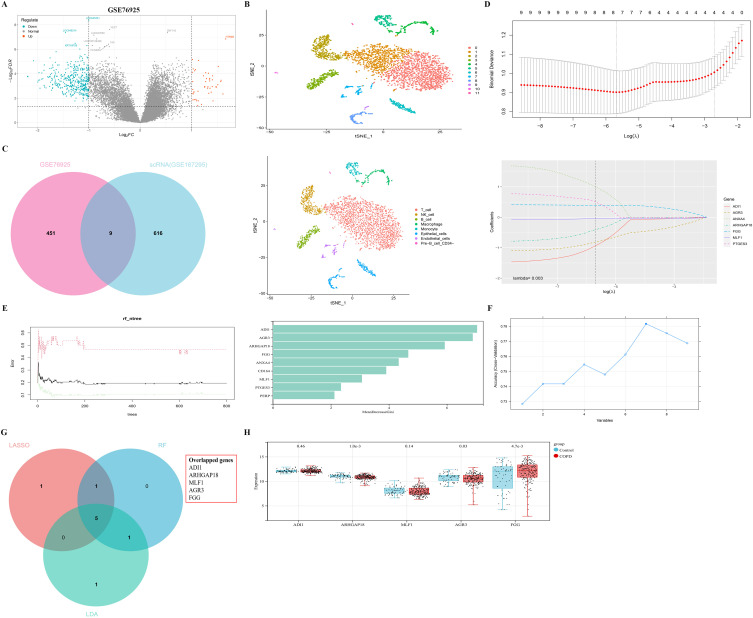
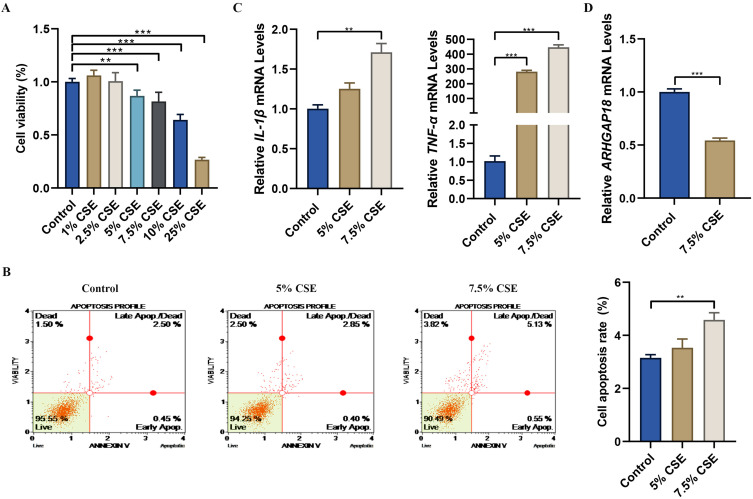
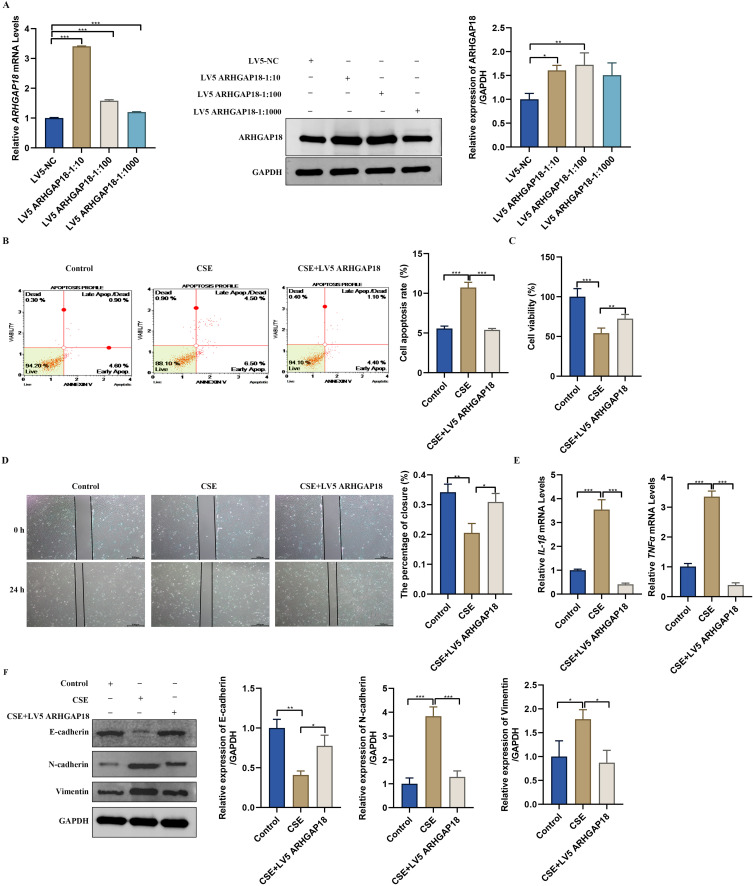
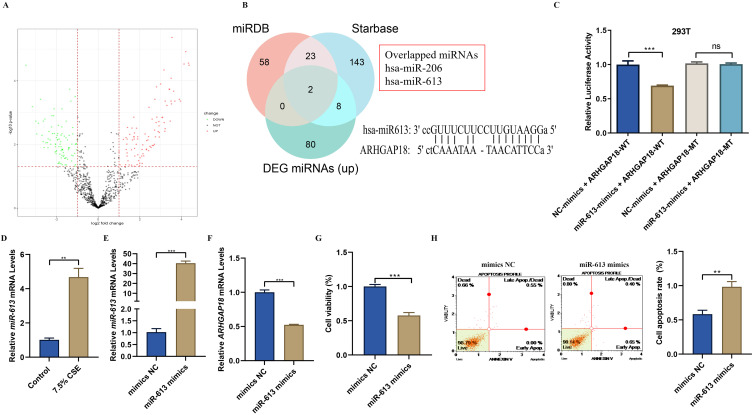
Methods: We initially identified the marker gene closely related to epithelial dysfunction in COPD by integrating bioinformatic analyses. ARHGAP18 expression in CSE-induced bronchial epithelial cells (BEAS-2B) was detected by qRT-PCR. Besides, ARHGAP18 levels were modulated by lentivirus-mediated overexpression. Thereafter, cell variability, apoptosis, and migration were detected by CCK8, flow cytometry, and wound healing assay. IL-1β and TNF-α levels were examined by qRT-PCR. Epithelial-mesenchymal transition (EMT)-associated proteins were determined by Western blotting. The function of miR-613 in COPD was further detected. Functional rescue experiments were performed to determine the mechanism of ARHGAP18 in COPD.

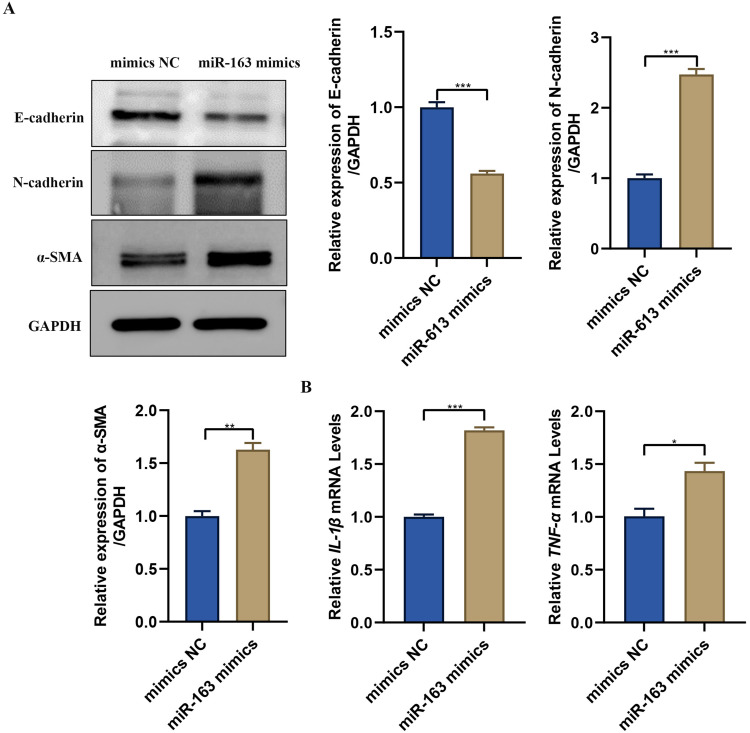
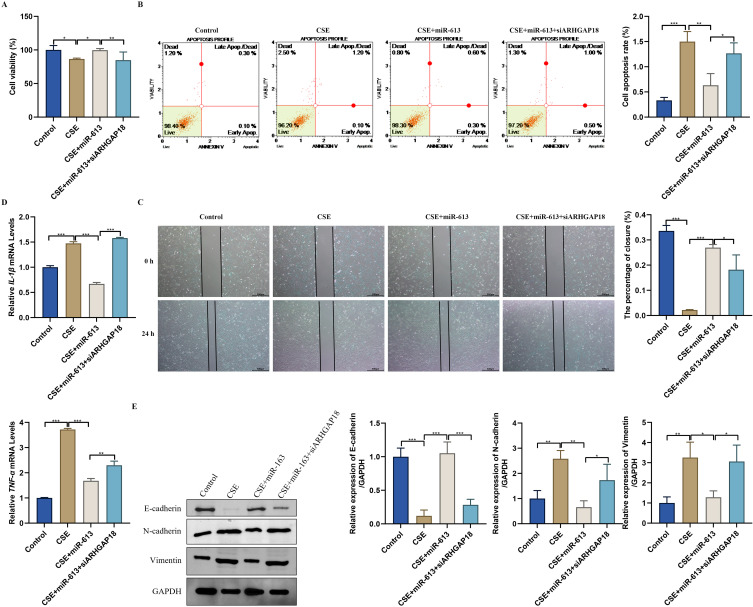
Results: Our study identified ARHGAP18 as the key gene associated with epithelial dysfunction in COPD. ARHGAP18 was downregulated in CSE-induced BEAS-2B cells. Overexpression of ARHGAP18 inhibited cell apoptosis of BEAS-2B cells and enhanced their proliferation and migration. Besides, ARHGAP18 overexpression reduced IL-1 β and TNF-α levels, enhanced E-cadherin expression, and suppressed Vimentin and N-cadherin expression. In contrast, miR-613 mimics exerted opposite effects. Furthermore, downregulation of ARHGAP1, mediated by miR-613 inhibitor promoted cell apoptosis and EMT of CSE-induced BEAS-2B cells, suggesting a regulatory role of miR-613 in COPD pathogenesis.

Conclusion: These findings highlight miR-613/ARHGAP18 axis as a critical regulator of epithelial dysfunction in COPD, offering a potential therapeutic target to counteract apoptosis, inflammation, and airway remodeling.

Keywords: ARHGAP18; apoptosis; chronic obstructive pulmonary disease; epithelial-mesenchymal transition; miR-613.


Conflict of interest statement

There are no conflicts of interest related to this study.

Figures

Figure 1
Figure 1
ARHGAP18 was an epithelial cell-specific gene in COPD. (A) Volcano plot of differentially expressed genes in COPD. The analysis was based on GSE76925 dataset, which includes 111 COPD patients and 40 controls. Red and blue dots represent up-regulated and downregulated genes, respectively. The gray dots indicate non-differentially expressed genes. The cutoff values were set as logFC> 1 or < −1 and adjusted p-value< 0.05. (B) The tSNE plot shows the distribution of different clusters and their corresponding cell annotations. The analysis was performed on the GSE76925 dataset from single-cell RNA-seq data. The plot illustrates the distribution of various cell types, including epithelial cells, macrophages, T cells, etc. Each point represents a single cell, and the colors correspond to different cell types as indicated in the legend. (C) Overlap genes of GSE76925 dataset and scRNA dataset. (D) Variables were screened by LASSO regression analysis based on the GSE76925 dataset. The plot shows the coefficient profiles of the variables (genes) during the LASSO regression process. The optimal lambda value was chosen as 0.003, and the corresponding variables were selected for further analysis. (E) Genes were ranked by importance using a random forest algorithm. The plot shows the importance scores of the top genes. The higher the score, the more important the gene is in distinguishing COPD samples from normal samples. (F) Genes were identified through SVM-RFE. The plot shows the accuracy of the model during the recursive feature elimination process. The genes were ranked according to their contribution to the classification accuracy. (G) The intersection of key genes was screened by the three methods. (H) The expression of the key genes was validated in the GSE47460 dataset (205 COPD patients and 63 controls). The box plots show the expression levels of these genes in COPD patients and normal controls. The error bars represent the standard deviation, and the p-values were calculated using t-test. The p-value thresholds were set as 0.05.
Figure 2
Figure 2
ARHGAP18 was downregulated in CSE-induced BEAS-2B cells. (A) Cell viability was assessed by CCK8 assay in BEAS-2B cells treated with different concentrations of CSE. (B) Cell apoptosis was examined using flow cytometry in BEAS-2B cells with CSE treatment. (C) The expression levels of IL-1β and TNF-α were examined by qRT-PCR in CSE-induced BEAS-2B cells. (D) The expression of ARHGAP18 was detected by qRT-PCR in CSE-induced BEAS-2B cells. The results are presented as the mean ± SD of three independent experiments (n= 3). One-way ANOVA was applied for multi-group comparisons, with statistical significance set as p< 0.05. **: p< 0.01, and ***: p< 0.0001.
Figure 3
Figure 3
Overexpression of ARHGAP18 inhibited cell apoptosis and EMT and enhanced proliferation and migration of BEAS-2B cells in vitro. (A) Overexpression efficiency of ARHGAP18 in BEAS-2B cells was detected by qRT-PCR and Western blotting. (B) The effect of ARHGAP18 overexpression on the apoptosis of BEAS-2B was detected by flow cytometry. (C) CCK8 was performed to assess the influence of ARHGAP18 overexpression on the cell viability of BEAS-2B. (D) The impact of ARHGAP18 overexpression on the migration of BEAS-2B was detected by wound healing assay. (E) The levels of IL-1β and TNF-α were measured by qRT-PCR. (F) The levels of E-cadherin, N-cadherin, and Vimentin were measured by Western blotting. The results are presented as the mean ± SD of three independent experiments (n= 3). One-way ANOVA was applied for multi-group comparisons, with statistical significance set as p< 0.05. *: p< 0.05, **: p< 0.01, and ***: p< 0.0001.
Figure 4
Figure 4
miR-613 mimics promoted cell apoptosis and inhibited proliferation and migration of BEAS-2B cells in vitro. (A) Volcano plot of differentially expressed miRNAs in COPD based on GSE24709 dataset (24 COPD and 19 controls). Red and blue dots represent up-regulated and downregulated genes, respectively. The gray dots indicate non-differentially expressed genes. The cutoff values were set as logFC> 1 or < −1 and adjusted p-value< 0.05. (B) Overlapped miRNAs of miRDB, Starbase, and differentially expressed miRNAs. (C) The targeting relationship between miR-613 and ARHGAP18 was explored by dual luciferase reporter gene assay. (D) The expression of miR-613 was detected by qRT-PCR in CSE-induced BEAS-2B cells. (E) Overexpression efficiency of miR-613 in BEAS-2B cells was detected by qRT-PCR. (F) The impact of miR-613 mimics on ARHGAP18 was determined by qRT-PCR. (G and H) Cell viability and apoptosis were investigated by CCK8 and flow cytometry. The results are presented as the mean ± SD of three independent experiments (n= 3). One-way ANOVA was applied for multi-group comparisons, with statistical significance set as p< 0.05. **: p< 0.01, and ***: p< 0.0001.
Figure 5
Figure 5
miR-613 mimics promoted EMT and inflammatory response. (A) The impact of miR-613 mimics on EMT-related protein levels was determined by Western blotting. (B) The levels of IL-1β and TNF-α were measured by qRT-PCR. The results are presented as the mean ± SD of three independent experiments (n= 3). One-way ANOVA was applied for multi-group comparisons, with statistical significance set as p < 0.05. *: p< 0.05, **: p< 0.01, and ***: p< 0.0001.
Figure 6
Figure 6
miRNA-613 alleviates EMT and inflammatory response by upregulating ARHGAP18. (A–C) Cell viability, apoptosis, and migration were determined by CCK8, flow cytometry, and wound healing assay in CSE-induced BEAS-2B cells. (D) qRT-PCR analysis of IL-1β and TNF-α in CSE-BEAS-2B cells. (E) Expression of EMT markers (E-cadherin, N-cadherin, and Vimentin) measured by Western blotting. The results are presented as the mean ± SD of three independent experiments (n= 3). One-way ANOVA was applied for multi-group comparisons, with statistical significance set as p< 0.05. *: p< 0.05, **: p< 0.01, and ***: p< 0.0001.

Similar articles

References

    1. Christenson SA, Smith BM, Bafadhel M, Putcha N. Chronic obstructive pulmonary disease. Lancet. 2022;399(10342):2227–2242. doi: 10.1016/S0140-6736(22)00470-6 - DOI - PubMed
    1. Hurst JR, Siddiqui MK, Singh B, Varghese P, Holmgren U, de Nigris E. A systematic literature review of the humanistic burden of COPD. International Journal of Chronic Obstructive Pulmonary Disease. 2021;16:1303–1314. doi: 10.2147/COPD.S296696 - DOI - PMC - PubMed
    1. Halpin DM. Do the ‘missing millions’ of COPD patients want to be found? Thorax. 2023;78(6):531–532. doi: 10.1136/thorax-2023-220113 - DOI - PubMed
    1. Mao R, Liu Z, Zhao Y, et al. Stable Chronic Obstructive Pulmonary Disease (COPD) management under a tiered medical system in China. Int J Chronic Obstruct Pulm Dis. 2022;17:181–194. doi: 10.2147/COPD.S333274 - DOI - PMC - PubMed
    1. Xu J, Zeng Q, Li S, Su Q, Fan H. Inflammation mechanism and research progress of COPD. Front Immunol. 2024;15:1404615. doi: 10.3389/fimmu.2024.1404615 - DOI - PMC - PubMed

MeSH terms