. 2025 Jul;31(7):e70374.
doi: 10.1111/gcb.70374.

Pre-Exposure to Chemicals Increases Springtail Vulnerability to High Temperatures

Affiliations

Pre-Exposure to Chemicals Increases Springtail Vulnerability to High Temperatures

Micha Wehrli et al. Glob Chang Biol. 2025 Jul.

Abstract

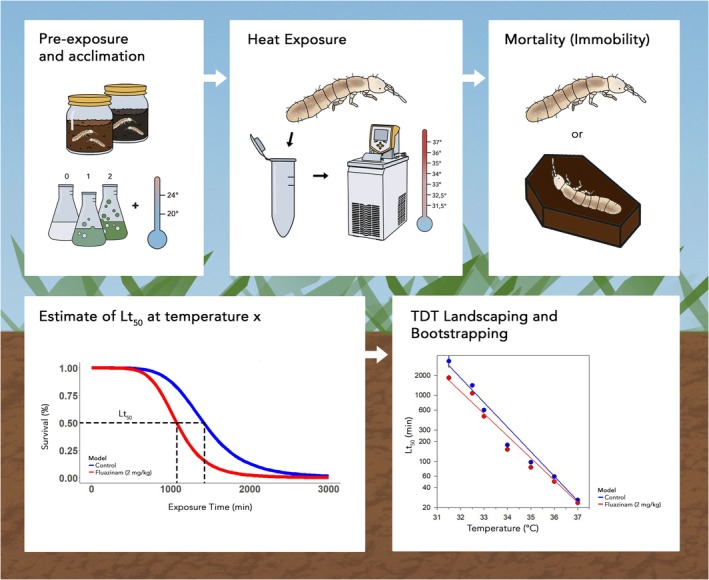
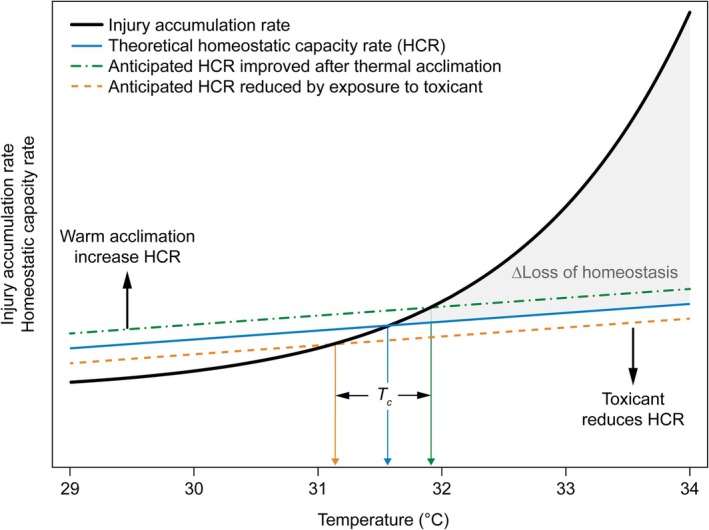
Global climate change is increasing the frequency and intensity of heat waves, posing a significant threat to ectothermic organisms. Concurrently, chemical pollution, including heavy metals and pesticides, remains a pervasive environmental stressor. This study investigates the effects of sub-lethal copper and fluazinam exposure on the thermal tolerance of the soil-dwelling springtail, Folsomia candida. Using a thermal death time (TDT) framework, we assessed how pre-exposure to these toxicants at two acclimation temperatures (20°C and 24°C) influenced survival under heat stress. Our findings indicate that toxicant exposure reduced heat tolerance at moderately high temperatures (32.5°C) but had negligible effects at extreme temperatures (37°C). Acclimation at 24°C mitigated the negative effects of both toxicants, suggesting an enhanced capacity for cellular homeostasis under warm conditions. Additionally, soil type influenced thermal tolerance, highlighting the importance of environmental context in multiple stressor interactions. These findings highlight the need to integrate realistic thermal exposure scenarios in ecotoxicological assessments to improve predictions of organismal vulnerability under climate change.

Keywords: Folsomia candida; Collembola; climate change; multiple stressors; pesticides; soil arthropods; thermal death time; thermal stress.


Conflict of interest statement

The authors declare no conflicts of interest.

Figures

FIGURE 1
FIGURE 1
Schematic outline of the experimental principle.
FIGURE 2
FIGURE 2
Thermal death time (TDT; the time taken to reach 50% mortality) of adult Folsomia candida. 356 plotted against exposure temperature. Before TDT assays, animals were pre‐exposed to LUFA soil contaminated with fluazinam at either 20°C (circles) or 24°C (squares). TDT values were calculated in minutes (see text for further explanation). Error bars represent SE; where not seen, the SE is hidden by the symbol. White symbols: Control soil (no contaminant), blue symbols: 2 mg fluazinam kg‐1 dry soil, red symbols: 10 mg fluazinam kg‐1. Note the log‐scale on the y‐axis.
FIGURE 3
FIGURE 3
Thermal death time (TDT; the time taken to reach 50% mortality) of adult Folsomia candida plotted against exposure temperature. Before TDT assays, animals were pre‐exposed to Hygum soil contaminated by copper at either 20°C (circles) or 24°C (squares). TDT values were calculated in minutes (see text for further explanation). Error bars represent SE; where not seen, the SE is hidden by the symbol. White symbols: Control soil (no contaminant), blue symbols: Medium copper, red symbols: High copper. Note the Log‐scale on the y‐axis.
FIGURE 4
FIGURE 4
The intercepts (A) and slopes of regression lines fitted to TDT data (B) as well as the estimated Lt50 at 32.5°C (C) and Lt50 at 37.0°C (D) of adult Folsomia candida . Before TDT assays, animals were pre‐exposed to LUFA soil contaminated with fluazinam or Hygum soil contaminated by copper at either 20°C or 24°C. Error bars represent 95% confidence intervals. If the 95% confidence intervals were not overlapping between estimates, they were interpreted as a statistically significant difference.
FIGURE 5
FIGURE 5
The thermal injury accumulation rate (solid black curve; the inverse of Lt50) is balanced by a capacity for cellular homeostatic maintenance (solid blue line). The homeostatic capacity rate (HCR) describes the ability of an organism to sustain and repair cellular damage by restoring and maintaining internal stability (homeostasis) in response to internal or external stressors. Ørsted et al. (2022) suggested a ~linear relationship of HCR with temperature. The black solid curve shows a theoretical relationship between rate of thermal injury accumulation and temperature. The blue solid line shows a theoretical homeostatic capacity rate under control conditions. When the temperature is below a critical temperature, T c (indicated by the vertical blue arrow), the homeostatic capacity exceeds the injury accumulation rate, and the animal can maintain cellular homeostasis. At temperatures above T c, the rate of injury accumulation is higher than the homeostatic capacity rate, causing cellular damage to build up, followed by mortality (ΔLoss of homeostasis, the shaded area). In theory, exposure to a toxicant would decrease the homeostatic capacity rate since handling of the toxicant leaves less capacity to repair damage from thermal stress (shown as the orange dashed line). Similarly, acclimation to warmer conditions could improve the homeostatic capacity rate and with that the repair rate of thermal injury (shown as the dashed green line). Accordingly, T c will be shifted to a higher temperature upon acclimation to warmer conditions (i.e., the animal becomes more tolerant of high temperatures), but to a lower temperature upon exposure to a toxicant (the animal becomes more susceptible to thermal stress). Lastly, the gain or loss of thermal tolerance will be much higher at relatively mild heat (i.e., slightly above T c) than at high thermal stress because the relative change in Δloss of homeostasis is considerably higher in the former case. The figure and its concept is adapted from Ørsted et al. (2022).

References

    1. Bowler, K. 2018. “Heat Death in Poikilotherms: Is There a Common Cause?” Journal of Thermal Biology 76: 77–79. - PubMed
    1. Cossins, A. R. , and Bowler K.. 1987. Temperature Biology of Animals. Chapman and Hall.
    1. Dai, W. C. , Slotsbo S., van Gestel C. A. M., and Holmstrup M.. 2021. “Temperature‐Dependent Toxicokinetics of Phenanthrene in Enchytraeus albidus (Oligochaeta).” Environmental Science & Technology 55, no. 3: 1876–1884. 10.1021/acs.est.0c06182. - DOI - PubMed
    1. Dallas, H. F. , and Rivers‐Moore N. A.. 2012. “Critical Thermal Maxima of Aquatic Macroinvertebrates: Towards Identifying Bioindicators of Thermal Alteration.” Hydrobiologia 679, no. 1: 61–76. 10.1007/s10750-011-0856-4. - DOI
    1. Delnat, V. , Tran T. T., Verheyen J., van Dinh K., Janssens L., and Stoks R.. 2019. “Temperature Variation Magnifies Chlorpyrifos Toxicity Differently Between Larval and Adult Mosquitoes.” Science of the Total Environment 690: 1237–1244. 10.1016/j.scitotenv.2019.07.030. - DOI - PubMed

LinkOut - more resources