Clinical Trial
. 2025 Sep;31(10):1218-1230.
doi: 10.1177/13524585251355842. Epub 2025 Jul 23.

Brain atrophy and associations with long-term disability and cognitive function in participants with relapsing multiple sclerosis treated with ozanimod: Results from phase 3 and open-label extension trials

Affiliations
Clinical Trial

Brain atrophy and associations with long-term disability and cognitive function in participants with relapsing multiple sclerosis treated with ozanimod: Results from phase 3 and open-label extension trials

Jeffrey A Cohen et al. Mult Scler. 2025 Sep.

Abstract

Background: In phase 3 trials, ozanimod reduced brain atrophy and improved cognitive processing speed compared with interferon β-1a (IFN) in participants with relapsing multiple sclerosis (RMS).

Objectives: To assess long-term brain volume changes and associations with clinical/cognitive outcomes during an open-label extension ([OLE] DAYBREAK [NCT02576717]).

Methods: Completers of phase 3 "parent" trials were eligible to receive ozanimod 0.92 mg in DAYBREAK. Whole brain, thalamic, and cortical gray matter volumes (WBV, TV, and CGMV, respectively) were analyzed annually.

Results: Participants receiving continuous ozanimod had sustained, low rates of WBV loss through OLE month (M)60 (annualized least-squares mean percent change from parent baseline: RADIANCE, -0.27; SUNBEAM, -0.35). Compared with participants switched from IFN, these participants had lower reductions in WBV (parent baseline through OLE M48 [RADIANCE] and OLE M60 [SUNBEAM]). Larger baseline brain volumes were associated with numerically better Symbol Digit Modalities Test scores and lower 3-month confirmed disability progression (CDP) incidence. Annualized TV atrophy ⩽1.0% was associated with lower 3-month CDP.

Conclusion: This study confirms the sustained efficacy of ozanimod in reducing brain atrophy rates for up to 7 years. Brain volume preservation was associated with faster cognitive processing speed and slower physical disability progression.

Keywords: MRI; Multiple sclerosis; Symbol Digit Modalities Test; confirmed disability progression; sphingosine 1-phosphate receptor modulators; thalamus.


Conflict of interest statement

Declaration of Conflicting InterestsThe author(s) declared the following potential conflicts of interest with respect to the research, authorship, and/or publication of this article: J.A.C.: personal compensation for consulting for Astoria, Atara, Biogen, Bristol Myers Squibb, Convelo, and Viatris. D.L.A.: consulting fees from Biogen, Biohaven, Bristol Myers Squibb, Eli Lilly, EMD Serono, Find Therapeutics, Frequency Therapeutics, GlaxoSmithKline, Idorsia Pharmaceuticals, Kiniksa Pharmaceuticals, Merck, Novartis, Race to Erase MS, Roche, Sanofi-Aventis, Shionogi, and Xfacto Communications and equity interest in NeuroRx. J.D.: personal compensation for consulting from Biogen, Bristol Myers Squibb, Janssen Pharmaceuticals, and Novartis; speaker for Biogen, Consortium of MS Centers, and EMD Serono; and grant funding from Biogen, Bristol Myers Squibb, Canadian MS Society, Consortium of MS Centers, EMD Serono, Genentech, National Institutes of Health, and National MS Society. H.-P.H.: personal fees for consulting, serving on steering committees, and speaking from Bayer Healthcare, Biogen, Celgene, GeNeuro, Genzyme, MedImmune, Merck, Novartis, Octapharma, Roche, Sanofi, and TG Therapeutics. L.K.: received no personal compensation. His institutions (University Hospital Basel/Stiftung Neuroimmunology and Neuroscience Basel) received payments for steering committee, advisory and data safety monitoring board participation, consultancy services, and educational activities from Bayer, Biogen, Bristol Myers Squibb, Celltrion, Clene Nanomedicine, EMD Serono Research and Development, Galapagos, Genentech, Immunic, Janssen, Kiniksa Pharmaceuticals, Laboratoires Juvise Pharmaceuticals, Merck Healthcare, Merck Sharp & Dohme, Minoryx Therapeutics, Neurostatus-UHB, Novartis, Roche, Sanofi, Shionogi, Wellmera, and Zai Lab and research support from Novartis, Roche, and Innosuisse. G.C.: compensation for consulting and/or speaking activities from Almirall, Biogen, Celgene, EXCEMED, Forward Pharma, Genzyme, Merck, Novartis, Roche, Sanofi, and Teva. K.S.: consulting for Biogen, Celgene, Genzyme, Merck, Novartis, Ono Pharma, Roche, Synthon, and Teva. L.S.: consulted for AbbVie, Atreca, Bristol Myers Squibb, EMD Serono, Novartis, Pasithea, Teva, TG Therapeutics, and 180 Life Sciences and research support from Atara and Bristol Myers Squibb. A.B.-O.: personal fees for advisory board participation and/or consulting from Abata, Accure, Atara Biotherapeutics, Biogen, BMS/Celgene/Receptos, GlaxoSmithKline, Gossamer, Horizon Therapeutics, Immunic, Janssen/Actelion, MedImmune, Merck/EMD Serono, Novartis, Roche/Genentech, Sangamo, Sanofi-Genzyme, and Viracta and grant support to the University of Pennsylvania from Biogen, Merck/EMD Serono, Novartis, and Roche/Genentech. X.M.: Professor Montalban’s institution has received compensation for lecture honoraria and travel expenses, participation in scientific meetings, clinical trial steering committee membership, or clinical advisory board participation in recent years from AbbVie, Actelion, Alexion, AstraZeneca, Autolus, Bial PD, Biogen, Bristol Myers Squibb/Celgene, EMD Serono, Genzyme, Hoffmann-La Roche, Immunic Therapeutics, Indivi, Janssen Pharmaceuticals, Juvisé Pharmaceutical, Lilly, MedDay, Medscape, Merck, Merz Therapeutics, Mylan-Viatris, Nervgen, Neuraxpharm, Novartis, Peervoice, Rewind Therapeutics, Samsung-Biosys, Sandoz, Sanofi-Genzyme, Teva Pharmaceuticals, TG Therapeutics, Zenas Biopharma, Excemed, ECTRIMS, MSIF, and NMSS or any of their affiliates. E.K.H.: honoraria/research support from Biogen, Merck Serono, Novartis, Roche, and Teva; has served as a member of advisory boards for Actelion, Biogen, Celgene, Merck Serono, Novartis, and Sanofi-Genzyme; and support from the Czech Ministry of Education—project Cooperatio LF1, research area Neuroscience, and the project National Institute for Neurological Research (Program EXCELES, ID project No LX22NPO5107)—funded by the European Union-Next Generation EU. J.K.S.: former employee of Bristol Myers Squibb. C.P., C.Y.C., and J.V.R.: employees and/or shareholders of Bristol Myers Squibb. B.A.C.C.: personal compensation for consulting from Alexion, Atara, Autobahn, Avotres, Biogen, Boston Pharma, EMD Serono, Gossamer Bio, Hexal/Sandoz, Horizon, Immunic AG, Kyverna, Neuron23, Novartis, Sanofi, Siemens, and TG Therapeutics and research support from Genentech and Kyverna.

Figures
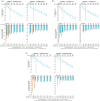
Each row plots LS mean percentage change and annualized percentage change in whole brain volume and thalamic volume from parent-trial baseline over time for interferon beta-1a vs IFN beta-1a treatments. Each graph has a legend explaining the symbols used.
Figure 1.
LS mean percentage change and annualized percentage change in whole brain volume (a), thalamic volume (b), and cortical gray matter volume (c) loss over time relative to parent-trial baseline. BL: baseline; CGMV: cortical gray matter volume; IFN: interferon; LS: least squares; ns: not statistically significant (p ⩾ 0.05); OLE: open-label extension (DAYBREAK); SE: standard error; TV: thalamic volume; WBV: whole brain volume. p-values presented are nominal, as treatment comparisons in this post hoc, exploratory analysis were not subject to multiplicity adjustment. LS mean percentage change from parent-trial baseline was estimated using a mixed model for repeated measures. The model included percentage change or atrophy rate from parent-trial baseline in brain volume as the dependent variable and stratification factors (region [Eastern Europe vs. rest of the world], baseline Expanded Disability Status Scale category [⩽3.5 vs. >3.5]), age at parent-trial baseline, treatment, time point, and the interaction between treatment and time point as fixed effects, parent-trial baseline brain volume as a continuous covariate, and subject as a random effect. For OLE visits, treatment duration during the parent trial was added as a fixed effect in addition to the effects above. *p < 0.05; p < 0.01; p < 0.001; §p < 0.0001, versus IFN β-1a.
The image presents graphs comparing IFNβ-1a and Oziamimd 0.92 mg TV treatment effects on SDMT mean scores, SDMT score category change in 18-months and percentage of participants with improved, worsened, or stable SDMTs for different baseline tertiles.
Figure 2.
SDMT mean scores (a) and categories of SDMT score change in participants treated with IFN β-1a (b) and ozanimod 0.92 mg (c) by TV baseline tertile in SUNBEAM. CI: confidence interval; IFN: interferon; LS: least squares; M: month; OLE: open-label extension; PT: parent trial; SDMT: Symbol Digit Modalities Test; SE: standard error; TV: thalamic volume. aBased on t-distribution. bOLE month 12 visit included data collected after OLE first dose date up to OLE month 12. cBased on Wald 95% CI.
Proportions of participants with 3-month confirmed disability progression by baseline thalamic volume tertiles and by thalamic atrophy rates at the end of the parent trial.
Figure 3.
Proportions of participants with 3-month CDPa by baseline thalamic volume tertiles (a) and by thalamic atrophy (⩽1.0%) rates at the end of parent trialb (b). CI: confidence interval; CDP: confirmed disability progression; HR: hazard ratio; IFN: interferon; OLE: open-label extension; TV: thalamic volume. aParticipants could have a 3-month CDP at any time during the parent trial or OLE. bFor SUNBEAM, this was at least 12 months; for RADIANCE, this was 24 months. The 95% CIs were calculated using the Clopper–Pearson method.
The image is a composite of four Kaplan-Meier survival curves that represent the progression of disability over a 3-month period for patients treated with interferon beta-1a or Ozanimod 0.92 mg, with the data divided into two trials: SUNBEAM and RADIANCE. Each pair of curves corresponds to one of the trials, showing the cumulative probability of disability progression (CDP) over time in months, segregated by baseline thalamic volume tertile (low vs. high). The curves are plotted on a logarithmic scale to fit the y-axis, which is labeled with the cumulative probability of CDP. The x-axis represents time in months, starting from 1, where 1 indicates the beginning of the trial or its open-label extension (OLE), and M48 represents 48 months in the study. Each graph contains a separate line for the low and high tertile of baseline thalamic volume, with the low tertile represented by short dashes and the high tertile by long dashes. This differentiation allows for a visual comparison between the two subgroups within each trial. The cumulative number of participants at risk at the beginning of each time point is listed in a table below each pair of curves. The trials are labeled as SUNBEAM (a) and RADIANCE (b), and the image is annotated with the following text: “Kaplan-Meier curves of 3-month CDPa by baseline thalamic volume tertile (low vs. high) in participants treated with IFN β-1a or Ozanimod 0.92 mg in SUNBEAM (a) and RADIANCE (b). CDP: confirmed disability progression; IFN: interferon; M: month; OLE: open-label extension. Participants could have a 3-month CDP at any time during the parent trial or OLE.”
Figure 4.
Kaplan-Meier curves of 3-month CDPa by baseline thalamic volume tertile (low vs. high) in participants treated with IFN β-1a or ozanimod 0.92 mg in SUNBEAM (a) and RADIANCE (b). CDP: confirmed disability progression; IFN: interferon; M: month; OLE: open-label extension. aParticipants could have a 3-month CDP at any time during the parent trial or OLE.
Graph showing predictors of 3-month confirm disability progression in the SUNBEAM (a and RADIANCE (b) trials: IFN β-1a and ozanimod 0.92mg in MS patients
Figure 5.
Predictors of 3-month CDP in participants treated with IFN β-1a or ozanimod 0.92 mg in SUNBEAM (a) and RADIANCE (b). CDP: confirmed disability progression; CGMV: cortical gray matter volume; EDSS: Expanded Disability Status Scale; GdE: gadolinium-enhancing; HR: hazard ratio; IFN: interferon; MS: multiple sclerosis; OLE: open-label extension; PASAT: Paced Auditory Serial Addition Test; SDMT: Symbol Digit Modalities Test; TV: thalamic volume; WBV: whole brain volume. aFor Z-scores at parent baseline, the predictor was normalized to mean 0 and unit variance. bAt parent baseline. cHazard ratios were based on the Cox proportional hazards model on 3-month CDP. Participants could have 3-month CDP at any time during the parent trial or OLE. A separate model was produced for each independent predictor as a factor, and nominal p-value is from Wald’s chi-square test. Other predictors that were tested but are not reported here are age,b sex,b body mass index,b weight,b years since MS symptom onset, pre-existing cardiac disease flag, pre-existing hepatic disease flag, prior MS treatment flag, number of GdE lesions group (>0 vs. 0),b number of GdE lesions at parent month 12 group (>0 vs. 0), EDSS score group (>2 vs. ⩽2),b log transformations of T2, unenhancing T1 lesion volumeb (µL), and GdE lesion volumeb (µL); T2 lesion counts, unenhancing T1 lesion counts, unenhancing T1 lesion counts,b GdE lesions counts,b and WBV,b TV,b and CGMVb (cm3).

References

    1. Filippi M, Bar-Or A, Piehl F, et al. Multiple sclerosis. Nat Rev Dis Primers 2018; 4: 43. - PubMed
    1. Thompson AJ, Baranzini SE, Geurts J, et al. Multiple sclerosis. Lancet 2018; 391: 1622–1636. - PubMed
    1. Reich DS, Lucchinetti CF, Calabresi PA. Multiple sclerosis. N Engl J Med 2018; 378: 169–180. - PMC - PubMed
    1. De Stefano N, Airas L, Grigoriadis N, et al. Clinical relevance of brain volume measures in multiple sclerosis. CNS Drugs 2014; 28: 147–156. - PubMed
    1. De Stefano N, Stromillo ML, Giorgio A, et al. Establishing pathological cut-offs of brain atrophy rates in multiple sclerosis. J Neurol Neurosurg Psychiatry 2016; 87: 93–99. - PMC - PubMed

Publication types

MeSH terms

Associated data

LinkOut - more resources