Path-MGCN: a pathway activity-based multi-view graph convolutional network for determining spatial domains
- PMID: 40698867
- PMCID: PMC12284772
- DOI: 10.1093/bib/bbaf365
Path-MGCN: a pathway activity-based multi-view graph convolutional network for determining spatial domains
Abstract
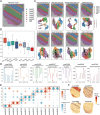
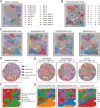
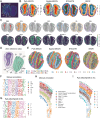
Spatial transcriptomics (ST) comprehensively measure the gene expression profiles while preserving the spatial information. Accumulated computational frameworks have been proposed to identify spatial domains, one of the fundamental tasks of ST data analysis, to understand the tissue architecture. However, current methods often overlook pathway-level functional context and struggle with data sparsity. Therefore, we develop Path-MGCN, a multi-view graph convolutional network (GCN) with attention mechanism, which integrates pathway information. We first calculate spot-level pathway activity scores via gene set variation analysis from gene expression and construct distinct adjacency graphs representing spatial and functional proximity. A multi-view GCN learns spatial, pathway, and shared embeddings adaptively fused by attention and followed by a Zero-inflated negative binomial decoder to retain the original transcriptome information. Comprehensive evaluations across diverse datasets (human dorsolateral prefrontal cortex, breast cancer and mouse brain) at various resolution demonstrate Path-MGCN's superior accuracy and robustness, significantly outperforming state-of-the-art methods and maintaining high performance across different pathway databases (Kyoto Encyclopedia of Genes and Genomes, Gene Ontology, Reactome). Crucially, Path-MGCN enhances biological interpretability, enabling the identification of Tertiary lymphoid structure-like regions and spatially resolved metabolic heterogeneity (hypoxia, glycolysis, AMP-activated protein kinase signaling) linked to tumor progression stages in human breast cancer. By effectively integrating functional context, Path-MGCN advances ST analysis, providing an accurate and interpretable framework to dissect tissue heterogeneity and enables detailed spatial mapping of molecular pathways that highlights potential targeted therapeutic strategies crucial for developing safe and effective synergistic anti-tumor therapies.
Keywords: attention mechanism; multi-view graph convolutional network; pathway; spatial domain; spatial transcriptomics.
© The Author(s) 2025. Published by Oxford University Press.
Figures


Similar articles
-
stGRL: spatial domain identification, denoising, and imputation algorithm for spatial transcriptome data based on multi-task graph contrastive representation learning.BMC Biol. 2025 Jul 1;23(1):177. doi: 10.1186/s12915-025-02290-z. BMC Biol. 2025. PMID: 40597202 Free PMC article.
-
stGNN: Spatially Informed Cell-Type Deconvolution Based on Deep Graph Learning and Statistical Modeling.Interdiscip Sci. 2025 Jun 26. doi: 10.1007/s12539-025-00728-0. Online ahead of print. Interdiscip Sci. 2025. PMID: 40571903
-
Enhancing Spatial Domain Identification in Spatially Resolved Transcriptomics Using Graph Convolutional Networks With Adaptively Feature-Spatial Balance and Contrastive Learning.IEEE/ACM Trans Comput Biol Bioinform. 2024 Nov-Dec;21(6):2406-2417. doi: 10.1109/TCBB.2024.3469164. Epub 2024 Dec 10. IEEE/ACM Trans Comput Biol Bioinform. 2024. PMID: 39331553
-
Systemic pharmacological treatments for chronic plaque psoriasis: a network meta-analysis.Cochrane Database Syst Rev. 2021 Apr 19;4(4):CD011535. doi: 10.1002/14651858.CD011535.pub4. Cochrane Database Syst Rev. 2021. Update in: Cochrane Database Syst Rev. 2022 May 23;5:CD011535. doi: 10.1002/14651858.CD011535.pub5. PMID: 33871055 Free PMC article. Updated.
-
Systemic pharmacological treatments for chronic plaque psoriasis: a network meta-analysis.Cochrane Database Syst Rev. 2017 Dec 22;12(12):CD011535. doi: 10.1002/14651858.CD011535.pub2. Cochrane Database Syst Rev. 2017. Update in: Cochrane Database Syst Rev. 2020 Jan 9;1:CD011535. doi: 10.1002/14651858.CD011535.pub3. PMID: 29271481 Free PMC article. Updated.
References
MeSH terms
Grants and funding
LinkOut - more resources
Full Text Sources

