. 2025 Jul 1;35(7):bhaf194.
doi: 10.1093/cercor/bhaf194.

Whisker pad stimulation with different frequencies reveals non-uniform modulation of functional MRI signal across sensory systems in awake rats

Affiliations

Whisker pad stimulation with different frequencies reveals non-uniform modulation of functional MRI signal across sensory systems in awake rats

Jaakko Paasonen et al. Cereb Cortex. .

Abstract

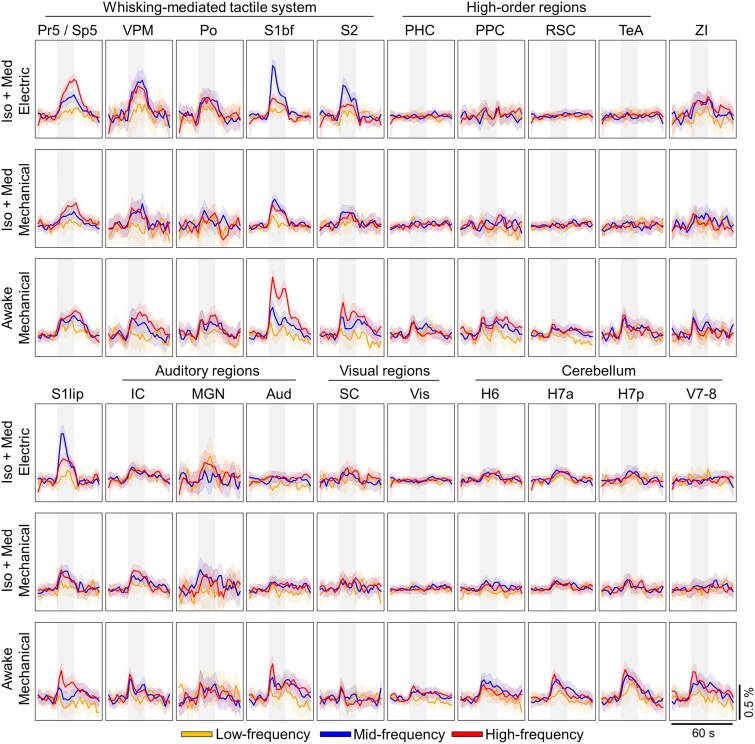
Primary sensory systems are traditionally considered separate units, but emerging evidence highlights notable interactions between them. Using a quiet and motion-tolerant zero-echo time functional magnetic resonance imaging technique, we examined brain-wide cross-sensory responses to whisker pad stimulation in awake and anesthetized rats. Our results indicate that whisker pad stimulation activated not only the whisker-mediated tactile system, but also auditory, visual, high-order, and cerebellar regions, demonstrating brain-wide cross-sensory and associative activity. Based on response characteristics, non-core regions responded to stimulation in a markedly different way compared to the primary sensory system, likely reflecting distinct encoding modes among primary sensory, cross-sensory, and integrative processing. Lastly, while low-order sensory activity was detectable under anesthesia, high-order processing and the complex differences between primary, cross-sensory, and associative systems were evident only in the awake state. This study reveals novel aspects of the cross-sensory interplay of the whisker-mediated tactile system and underscores the challenges of observing these phenomena in anesthetized rats.

Keywords: awake; functional magnetic resonance imaging; rat; stimulation; zero echo time.


Figures

Fig. 1
Fig. 1
Group-level statistical maps showing significant responses to mid-frequency whisker pad stimuli across 8 representative slices. White outlines on the statistical maps indicate the regions with P < 0.005 (FWE-corrected), while the color maps are thresholded with t-value > 2. The results are obtained from 208–224 stimulus blocks during 26–28 scans in each group. Values in the top row indicate the approximate distance from bregma for each slice. Statistical maps are overlaid on high-resolution anatomical images. A whole-brain view with 22 slices is shown in Supplementary Fig. S6. H6, hemisphere of cerebellar lobule 6 (simplex); H7a, anterior hemisphere of cerebellar lobule 7 (crus 1 and 2); H7p, posterior hemisphere of cerebellar lobule 7 (paramedian 1); Iso + med, isoflurane and medetomidine anesthesia; Po, posterior thalamic nuclei; Pr5/Sp5, principal trigeminal nuclei and spinal trigeminal nuclei; RSC, retrosplenial cortex; S1bf, primary somatosensory cortex, barrel field; S1lip, primary somatosensory cortex, lip region; TeA, temporal association cortex; V7–8, vermis of cerebellar lobules 7 and 8; VPM, ventral posteromedial thalamic nuclei.
Fig. 2
Fig. 2
Schematic illustration of the whisker-to-barrel cortex core pathway activated by either mechanical (air puff) or electrical stimulus (a), a 3D illustration of combined significant voxels (P < 0.005, FWE-corrected) from low-, mid-, and high-frequency analyses within each group (b), and a 3D presentation of ROIs used in the subsequent analyses (c). The results are obtained from 1,600 16-s stimulation blocks given during 54 sessions (520–560 stimuli blocks per group). The colors for ROIs in C correspond to those in Fig. 1.
Fig. 3
Fig. 3
Group-level mean time series for each ROI. Each average time series is a result of 104–224 stimuli (see Supplementary Table S1). The shaded vertical gray region indicates the timing for the 16-s stimulus block. The list of abbreviations for ROIs can be found in Fig. 1 and in Table 1. The 90% confidence interval is shown as a shaded region around the mean time series.
Fig. 4
Fig. 4
Group-level average fMRI response in each group and ROI. The average response was typically calculated over a 20 s window starting from the stimulus onset (see materials and methods). For each ROI and group, we tested (i) whether the slope determined by stimulation frequency and average response deviated from 0 (t-test), and (ii) whether the relationship between the stimulation frequency and average response was linear (normality test for residuals of the fit). Asterisk (*) denotes a significant linear slope (t-test for slope P < 0.05, normality test P > 0.05), and hash (#) denotes a significant non-linear slope (t-test for slope P < 0.05, normality test P < 0.05). The full list for uncorrected p-values can be found in Supplementary Table S2. The error bars indicate the 90% confidence interval. The list of abbreviations for ROIs can be found in Fig. 1 and in Table 1.
Fig. 5
Fig. 5
Hierarchical clusters of average fMRI response profiles. The average fMRI response profiles were derived from data shown in Fig. 4, and clustered by using hierarchical clustering. The correlation matrices on the left indicate the similarity between the frequency response profile curves across ROIs. The obtained hierarchical tree (or dendrogram) is shown on the right side of the matrices. Subsequently, average response curves were calculated for 3 main clusters for each group, which are shown in the middle. Clusters with single regions and high hierarchy were excluded from the illustrations, and regions without significant signal changes (Table 1) were left out from the analysis. The localization of the clusters is illustrated on the right. The clustered brain regions are color-coded in matrices, in the response profile graphs, and in the 3D illustrations. The cluster including brain stem nuclei is color-coded with the same color in each group. The shaded region around the average response profiles indicates the 90% confidence interval. The list of abbreviations for ROIs can be found in Fig. 1 and in Table 1.
Fig. 6
Fig. 6
Hierarchical clusters of average fMRI time series. When studying the temporal characteristics of the signal changes, fMRI time series were averaged across all stimulation frequencies and clustered by using hierarchical clustering. The correlation matrices on the left indicate the similarity between time series across ROIs. The obtained hierarchical tree (or dendrogram) is shown on the right side of the matrices. Subsequently, average time series were calculated for 3 to 4 main clusters for each group, which are shown in the middle. Clusters with single regions and high hierarchy were excluded from the illustrations, and regions without significant signal changes (Table 1) were omitted from the analysis. The localization of the clusters is illustrated on the right. The clustered brain regions are color-coded in matrices, in the response profile graphs, and in the 3D illustrations. The cluster including brain stem nuclei is color-coded with the same color in each group. The shaded vertical gray region indicates the timing of the 16-s stimulus block. The shaded region around the average time series indicates the 90% confidence interval. The list of abbreviations for ROIs can be found in Fig. 1 and in Table 1.

Update of

Similar articles

References

    1. Adibi M. 2019. Whisker-mediated touch system in rodents: from neuron to behavior. Front Syst Neurosci. 13:1–24. 10.3389/fnsys.2019.00040. - DOI - PMC - PubMed
    1. Adibi M, Lampl I. 2021. Sensory adaptation in the whisker-mediated tactile system: physiology, theory, and function. Front Neurosci. 15:1–23. 10.3389/fnins.2021.770011. - DOI - PMC - PubMed
    1. Aggleton JP, Yanakieva S, Sengpiel F, Nelson AJ. 2021. The separate and combined properties of the granular (area 29) and dysgranular (area 30) retrosplenial cortex. Neurobiol Learn Mem. 185:107516. 10.1016/j.nlm.2021.107516. - DOI - PubMed
    1. Ahn SJ, Anfray A, Anrather J, Iadecola C. 2023. Calcium transients in nNOS neurons underlie distinct phases of the neurovascular response to barrel cortex activation in awake mice. J Cereb Blood Flow Metab. 43:1633–1647. 10.1177/0271678X231173175. - DOI - PMC - PubMed
    1. Aminoff EM, Kveraga K, Bar M. 2013. The role of the parahippocampal cortex in cognition. Trends Cogn Sci. 17:379–390. 10.1016/j.tics.2013.06.009. - DOI - PMC - PubMed

LinkOut - more resources