. 2025 Apr 7;47(4):256.
doi: 10.3390/cimb47040256.

Mapping Small Extracellular Vesicle Secretion Potential in Healthy Human Gingiva Using Spatial Transcriptomics

Affiliations

Mapping Small Extracellular Vesicle Secretion Potential in Healthy Human Gingiva Using Spatial Transcriptomics

Blanka Maria Borowiec et al. Curr Issues Mol Biol. .

Abstract

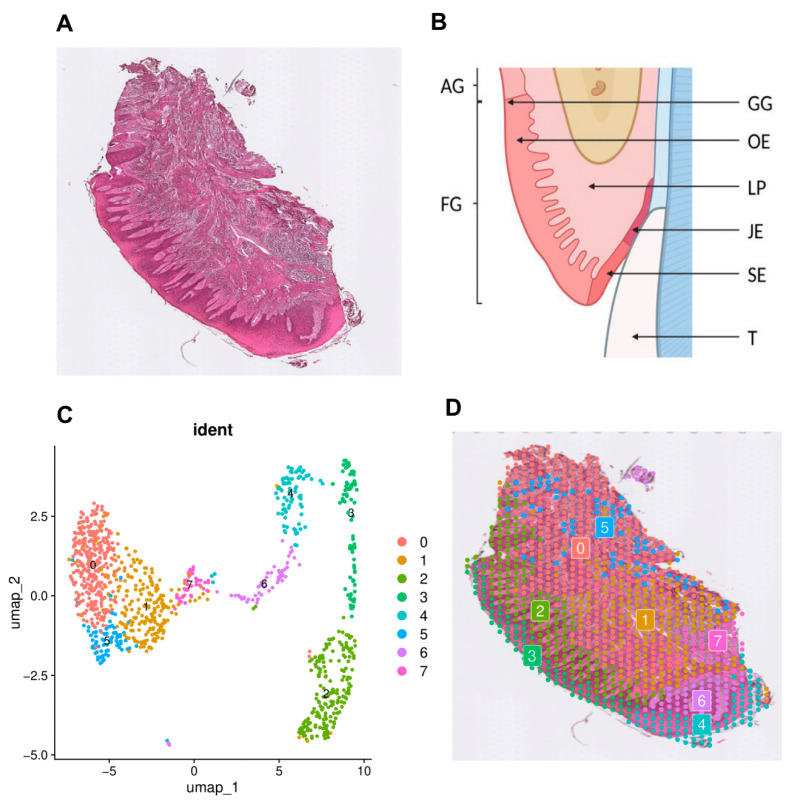
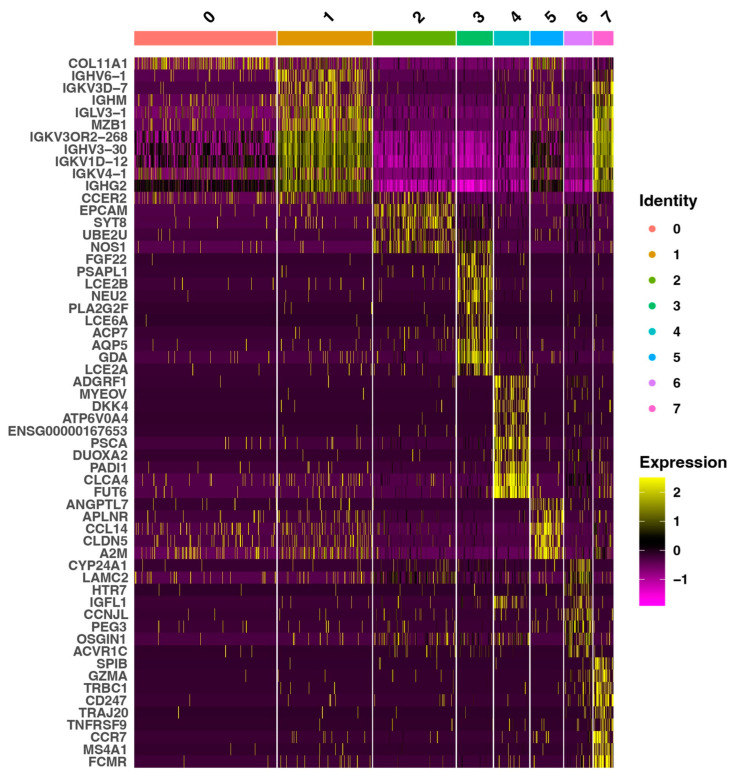
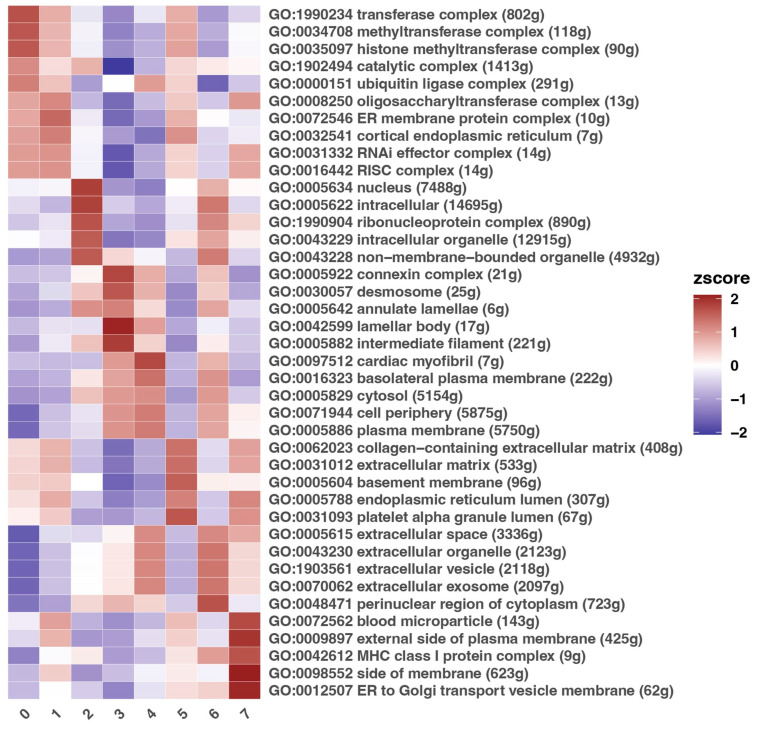
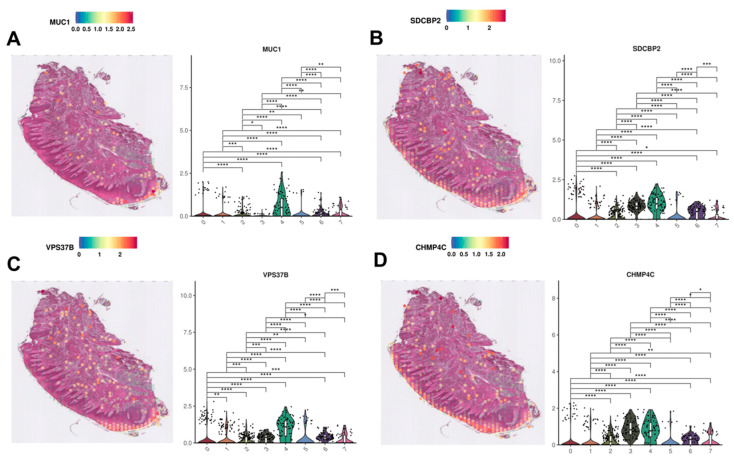
Regenerative processes occur at various levels in all organisms, yet their complexity continues to raise new questions about their mechanisms. It has been demonstrated that small extracellular vesicles (sEVs), secreted by all cells and influencing their function, play a significant role in regeneration. In the context of regenerative processes, oral mucosal tissues consistently receive interest, as they are among the most rapidly healing tissues in the human body. In this study, we utilized spatial transcriptomics to map gene expression to specific spatial locations within the gingiva tissue section, using publicly available transcriptomic data. This analysis revealed new insights into this tissue and the biogenesis of sEVs within it. The identified clusters encompassed two main regions-the epithelium and lamina propria-as well as minor niches within them. Using Gene Ontology (GO) analysis, we identified two clusters most enriched in extracellular vesicle-related GO processes. These included the superficial and deeper layers of the sulcular epithelium, one of the most peripheral regions of the gingiva. Of the 43 genes identified in the literature as having a potential or documented role in sEVs biogenesis, 12 were selected for further analysis. MUC1, SDCBP2, and VPS37B showed clear specificity and the highest expression in the superficial layer of the sulcular epithelium. CHMP4C also exhibited high expression in this layer, though its levels were comparable to the outer layer of the oral epithelium. Other well-established sEVs marker genes, such as ANXA2, CD9, CD63, CD81, FLOT1, RAB22A, RAB27B, and RAB5A, were also expressed in the examined tissue; however, their expression was not specifically exclusive to the sulcular epithelium. Our study is the first to perform a meta-analysis of available gingival transcriptomic data in the specific context of sEVs biogenesis. The presented data and conclusions provide new insights into the role of different structures within healthy human gingiva and shed new light on both known and potential markers of sEVs biogenesis. These findings may contribute to the development of regeneration-targeted research, especially on oral tissues.

Keywords: gingiva; oral mucosa; regeneration; small extracellular vesicles; spatial transcriptomics.


Conflict of interest statement

The authors declare no conflicts of interest.

Figures

Figure 1
Figure 1
The transcriptomic landscape of a healthy mucosa section—the gingiva of an adult human. (A) A histological image of the healthy oral mucosa section stained with hematoxylin and eosin (H&E). (B) A schematic illustration of the gingival area: AG—attached gingiva; FG—free gingiva; GG—gingival groove; OE—oral epithelium; LP—lamina propria; JE—junctional epithelium; SE—sulcular epithelium; T—tooth. (C) A Uniform Manifold Approximation and Projection (UMAP) plot of transcriptomic clusters identified in the tissue. A specific color distinguishes each cluster and corresponds to a distinct transcriptionally unique cell population or region of the mucosa: 0—stromal and stromal reticular cells (lamina propria); 1—stromal immune cells (lamina propria); 2—basal epithelial and stromal subepithelial cells (oral epithelium and lamina propria cusp); 3—suprabasal epithelial cells (oral epithelium); 4—suprabasal epithelial cells (sulcular epithelium); 5—stromal endothelial and immune cells (lamina propria); 6—basal epithelial and stromal subepithelial cells (sulcular epithelium and lamina propria cusp); 7—stromal immune cells (lamina propria). (D) Clusters from the UMAP representation are depicted as color-coded dots in the histological image of the oral mucosa slide. The colored grids correspond to spatially resolved transcriptomic spots, with each color representing a specific cluster from the UMAP analysis. Figure 1B was created with BioRender.com.
Figure 2
Figure 2
A heatmap of differentially expressed genes across eight identified transcriptional clusters. Each cluster’s top expressed genes (z-score normalized) are visualized on the heat map. Each column represents one characterized cluster, whereas each row corresponds to a single gene. The color scale transitions from purple (low expression) through black (median expression) to yellow (high expression). The numbers indicate the following clusters: 0—stromal and stromal reticular cells (lamina propria); 1—stromal immune cells (lamina propria); 2—basal epithelial and stromal subepithelial cells (oral epithelium and lamina propria cusp); 3—suprabasal epithelial cells (oral epithelium); 4—suprabasal epithelial cells (sulcular epithelium); 5—stromal endothelial and immune cells (lamina propria); 6—basal epithelial and stromal subepithelial cells (sulcular epithelium and lamina propria cusp); 7—stromal immune cells (lamina propria).
Figure 3
Figure 3
A heatmap of the Gene Ontology (GO) term enrichment scores (z-scores) for each cluster. Rows correspond to GO terms linked to cellular components, while columns indicate individual clusters. Red shading (z-score closer to +2) signifies relative enrichment, whereas blue shading (z-score closer to −2) indicates relative depletion. The numbers indicate the following clusters: 0—stromal and stromal reticular cells (lamina propria); 1—stromal immune cells (lamina propria); 2—basal epithelial and stromal subepithelial cells (oral epithelium and lamina propria cusp); 3—suprabasal epithelial cells (oral epithelium); 4—suprabasal epithelial cells (sulcular epithelium); 5—stromal endothelial and immune cells (lamina propria); 6—basal epithelial and stromal subepithelial cells (sulcular epithelium and lamina propria cusp); 7—stromal immune cells (lamina propria).
Figure 4
Figure 4
The spatial distribution and cluster expression of genes associated with extracellular vesicle biogenesis in the healthy human mucosa (AD). Each part of the selected gene includes an H&E-stained tissue section overlaid with color-coded spots reflecting gene expression (scale shown at the top of the graph). Warmer hues (orange/red) indicate higher transcript abundance. Furthermore, violin plots illustrate expression levels in clusters 0–7. * p < 0.05; ** p < 0.01; *** p < 0.001; **** p < 0.0001. The numbers indicate the following clusters: 0—stromal and stromal reticular cells (lamina propria); 1—stromal immune cells (lamina propria); 2—basal epithelial and stromal subepithelial cells (oral epithelium and lamina propria cusp); 3—suprabasal epithelial cells (oral epithelium); 4—suprabasal epithelial cells (sulcular epithelium); 5—stromal endothelial and immune cells (lamina propria); 6—basal epithelial and stromal subepithelial cells (sulcular epithelium and lamina propria cusp); 7—stromal immune cells (lamina propria).
Figure 5
Figure 5
The spatial distribution and cluster expression of genes associated with extracellular vesicle biogenesis in the healthy human mucosa (AH). Each part of the selected gene includes an H&E-stained tissue section overlaid with color-coded spots reflecting gene expression (scale shown at the top of the graph). Warmer hues (orange/red) indicate higher transcript abundance. Furthermore, violin plots illustrate expression levels in clusters 0–7. * p < 0.05; ** p < 0.01; *** p < 0.001; **** p < 0.0001. The numbers indicate the following clusters: 0—stromal and stromal reticular cells (lamina propria); 1—stromal immune cells (lamina propria); 2—basal epithelial and stromal subepithelial cells (oral epithelium and lamina propria cusp); 3—suprabasal epithelial cells (oral epithelium); 4—suprabasal epithelial cells (sulcular epithelium); 5—stromal endothelial and immune cells (lamina propria); 6—basal epithelial and stromal subepithelial cells (sulcular epithelium and lamina propria cusp); 7—stromal immune cells (lamina propria).

Similar articles

References

    1. Prabhu S.R. Textbook of General Pathology for Dental Students. Springer Nature; Berlin/Heidelberg, Germany: 2023. Healing: Tissue Regeneration and Repair; pp. 49–56. - DOI
    1. Poss K.D., Tanaka E.M. Hallmarks of Regeneration. Cell Stem Cell. 2024;31:1244–1261. doi: 10.1016/J.STEM.2024.07.007. - DOI - PMC - PubMed
    1. Yun M.H. Changes in Regenerative Capacity through Lifespan. Int. J. Mol. Sci. 2015;16:25392–25432. doi: 10.3390/ijms161025392. - DOI - PMC - PubMed
    1. Giancotti A., Monti M., Nevi L., Safarikia S., D’Ambrosio V., Brunelli R., Pajno C., Corno S., Di Donato V., Musella A., et al. Functions and the Emerging Role of the Foetal Liver into Regenerative Medicine. Cells. 2019;8:914. doi: 10.3390/cells8080914. - DOI - PMC - PubMed
    1. Glim J.E., Everts V., Niessen F.B., Ulrich M.M., Beelen R.H.J. Extracellular Matrix Components of Oral Mucosa Differ from Skin and Resemble That of Foetal Skin. Arch. Oral Biol. 2014;59:1048–1055. doi: 10.1016/J.ARCHORALBIO.2014.05.019. - DOI - PubMed

LinkOut - more resources