. 2025 May 29;47(6):403.
doi: 10.3390/cimb47060403.

Synergistic Antitumor Effects of Ivermectin and Metformin in Canine Breast Cancer via PI3K/AKT/mTOR Pathway Inhibition

Affiliations

Synergistic Antitumor Effects of Ivermectin and Metformin in Canine Breast Cancer via PI3K/AKT/mTOR Pathway Inhibition

Huili Feng et al. Curr Issues Mol Biol. .

Abstract

Ivermectin (IVM) is a macrolide antiparasitic drug, and Metformin (MET) is a biguanide oral hypoglycemic drug. Studies have shown that both of them have obvious anti-tumor effects, but there have been no reports on the combined treatment of Canine breast tumors. This report aimed to investigate the effectiveness and the possible mechanism of drug combination on Canine breast cancers. Mouse breast tumor cells (4T1) and canine breast tumor cells (CMT-1211) were, respectively, treated with IVM, MET, and their combination, and then cell viability was assessed. After that, transcriptomic analysis was performed to study the action pathway of the drug combination with regard to its anti-tumor effects. Reactive oxygen species (ROS) levels were detected by flow cytometry, and autophagosome formation was observed by transmission electron microscopy (TEM). Immunofluorescence detected the cytoplasmic translocation of LC3B and P62 into the nucleus. Western blot detected the protein expressions of LC3B, P62, Beclin1, Bcl-2, p-PI3K, p-AKT, and p-mTOR. Our transcriptomic analysis showed that the combination of IVM and MET regulated the expression of autophagy-related genes and pathways, including the PI3K/AKT/mTOR signaling pathway. Our in vitro experiments showed that the combination of two drugs had a considerably significant effect on cytotoxicity, ROS levels, and the formation of autophagosomes compared to each drug alone. Meanwhile, the in vivo experiments showed that IVM combined with MET had an obvious inhibitory effect on tumor growth in canine breast tumor xenografts. This study concluded that IVM with MET activated autophagy, which killed breast cancer cells by inhibiting the activation of the PI3K/AKT/mTOR pathway and promoting the excessive accumulation of ROS. It offers a theoretical foundation for the synergistic effects of MET and IVM to suppress breast cancer cell activity.

Keywords: PI3K/AKT/mTOR; ROS; autophagy; ivermectin; metformin.


Conflict of interest statement

All authors read and approved of this article in its present form. The authors declare no conflict of interest.

Figures

Figure 1
Figure 1
Cytotoxic effects of IVM, MET, and their combination on CMT-1211 and 4T1 cells. (A,B) CCK-8 assay detected CMT-1211 and 4T1 cell viability at 12 h, 24 h, and 48 h after IVM treatment. (C,D) CCK-8 assay detected CMT-1211 and 4T1 cell viability at 12 h, 24 h, and 48 h after MET treatment. (E,F) CCK-8 was used to evaluate the activity of CMT-1211 and 4T1 cells after 0 h, 12 h, 24 h, 36 h, 48 h, 60 h, and 72 h in different treatment groups. (G,H) IVM of 2 μM, 4 μM, and 6 μM were combined with MET of 2 mM, 4 mM, and 6 mM, respectively. CCK-8 method was used to evaluate the cell viability of CMT-1211 and 4T1 after treatment with different drug groups. (I) Cell viability of HC11 control cells.
Figure 2
Figure 2
The effects of IVM combined with MET on the migration and invasion of breast cancer cells. (AC) Wound healing test was used to measure the migration capacity of tumor cells for 24 h on A scale of 1000 µm. (D,E) The invasive ability of CMT-1211 and 4T1 cells treated with different treatment groups for 24 h was determined using Transwell chambers precoated with matrix gel. Scale: 100 µm. ** p < 0.001, *** p < 0.0001, **** p < 0.00001.
Figure 3
Figure 3
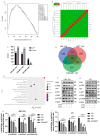
Analysis of transcriptome results. (A) The uniform distribution curve of the reads on the reference genome. (B) Hierarchical clustering diagram of gene expression levels in samples. (C) Differentially expressed genes were screened by IVM+MET/Ctrl group, IVM+MET/IVM group, IVM+MET/MET group. (D) Venn diagram of differentially expressed genes. (E) KEGG enrichment pathway. (FI) Western blotting was used to analyze the expression levels of different groups of PI3K, p-PI3K, AKT, p-AKT, mTOR, and p-mTOR in CMT-1211 and 4T1 cells. All the experiment results are the mean ± standard deviation of three independent experiments. * p < 0.05; ** p < 0.001; *** p < 0.0001; **** p < 0.00001; ns = not significant.
Figure 4
Figure 4
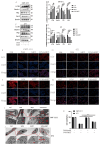
IVM, in combination with MET, promotes autophagy in breast cancer cells. (AD) After the cells were treated with different drug combinations for 24 h, the expression levels of LC3B, Beclin1, P62, and Bcl-2 were analyzed by Western blot. (EH) Immunofluorescence staining detected the LC3B and P62 expression levels of CMT-1211 and 4T1 cells after 24 h treatment with different drug methods. Scale: 200 µM. (I,J) TEM was used to observe the autophagosomes of CMT-1211 and 4T1 treated with different drug groups. Red boxes and red arrows pointed to the autophagosomes. 6000× Bar: 2 µM; 60,000× Bar: 200 nm. (K) After pre-treating the cells with 3-methyladenine (3-MA) and the combination group, the cell viability of CMT-1211 and 4T1 was detected by the CCK-8 kit. * p < 0.05; ** p < 0.001; *** p < 0.0001; **** p < 0.00001; ns = not significant.
Figure 5
Figure 5
IVM + MET induces autophagy in CMT-1211 and 4T1 by promoting excessive ROS accumulation. (A,B) Flow cytometry was used to detect the ROS levels of CMT-1211 cells after different treatment groups. PC (Red),Ctrl (Dark Green),IVM (Light Green),MET (Light blue),IVM + MET (Orange).(C,D) Flow cytometry was used to detect the ROS levels of 4T1 cells after different treatment groups. PC (Red),Ctrl (Light Green), IVM (Orange), MET (Light Blue), IVM + MET (Dark Green). (E,F) After being treated with 0 mM, NAC (10 mM), IVM + MET, and IVM + MET + NAC, the ROS levels of CMT-1211 cells were detected by flow cytometry. PC (Light Green), Ctrl (Light Blue), NAC (Red), IVM + MET (Orang),IVM + MET + NAC (Dark Green). (G,H) After being treated with 0 mM, NAC (10 mM), IVM + MET, and IVM + MET + NAC, the ROS levels of 4T1 cells were detected by flow cytometry. PC (Dark green), Ctrl (Light Blue), NAC (Orange), IVM + MET (Light Green), IVM + MET + NAC (Red). (IL) After 0 µM, NAC (10 mM), IVM+MET, IVM+MET+NAC, Western blotting was used to analyze the expression levels of PI3K, pPI3K, AKT, p-AKT, mTOR, and p-mTOR in CMT-1211 and 4T1 cells. (MP) After 0 µM, NAC (10 mM), IVM+MET, IVM+MET+NAC, Western blotting was used to analyze the expression levels of autophagy-related proteins LC3B, Beclin, P62, and Bcl-2 in CMT-1211 and 4T1 cells. * p < 0.05; ** p < 0.001; *** p < 0.0001; **** p < 0.00001; ns = not significant.
Figure 6
Figure 6
IVM combined with MET can inhibit the growth of canine breast tumor xenografts in vivo. (A) Establishing a mouse tumor model and a schematic diagram of the treatment plan. (B) Changes in the body weight of mice in each group during treatment. (C) Changes in tumor volume of mice in each group during treatment. (D,E) After euthanizing the mice, the tumors of the mice were collected and weighed. (F) H&E staining of mouse tumor tissues and organs (heart, liver, spleen, lung, kidney). (G) Immunofluorescence staining of LC3B and P62 in tumors. Scale: 200 µM. * p < 0.05; ** p < 0.001; **** p < 0.00001; ns = not significant.

Similar articles

References

    1. Katsura C., Ogunmwonyi I., Kankam H.K., Saha S. Breast cancer: Presentation, investigation and management. Br. J. Hosp. Med. 2022;83:1–7. doi: 10.12968/hmed.2021.0459. - DOI - PubMed
    1. Pinho S.S., Carvalho S., Cabral J., Reis C.A., Gärtner F. Canine tumors: A spontaneous animal model of human carcinogenesis. Transl. Res. 2012;159:165–172. doi: 10.1016/j.trsl.2011.11.005. - DOI - PubMed
    1. Khan M.M., Yalamarty S.S.K., Rajmalani B.A., Filipczak N., Torchilin V.P. Recent strategies to overcome breast cancer resistance. Crit. Rev. Oncol. 2024;197:104351. doi: 10.1016/j.critrevonc.2024.104351. - DOI - PubMed
    1. Liu H., Fan Z., Lin J., Yang Y., Ran T., Chen H. The recent progress of deep-learning-based in silico prediction of drug combination. Drug Discov. Today. 2023;28:103625. doi: 10.1016/j.drudis.2023.103625. - DOI - PubMed
    1. Antoszczak M., Markowska A., Markowska J., Huczyński A. Old wine in new bottles: Drug repurposing in oncology. Eur. J. Pharmacol. 2020;866:172784. doi: 10.1016/j.ejphar.2019.172784. - DOI - PubMed

LinkOut - more resources