. 2025 Jun 17;47(6):463.
doi: 10.3390/cimb47060463.

Selective Dual Inhibition of TNKS1 and CDK8 by TCS9725 Attenuates STAT1/β-Catenin/TGFβ1 Signaling in Renal Cancer

Affiliations

Selective Dual Inhibition of TNKS1 and CDK8 by TCS9725 Attenuates STAT1/β-Catenin/TGFβ1 Signaling in Renal Cancer

Majed Saad Al Fayi et al. Curr Issues Mol Biol. .

Abstract

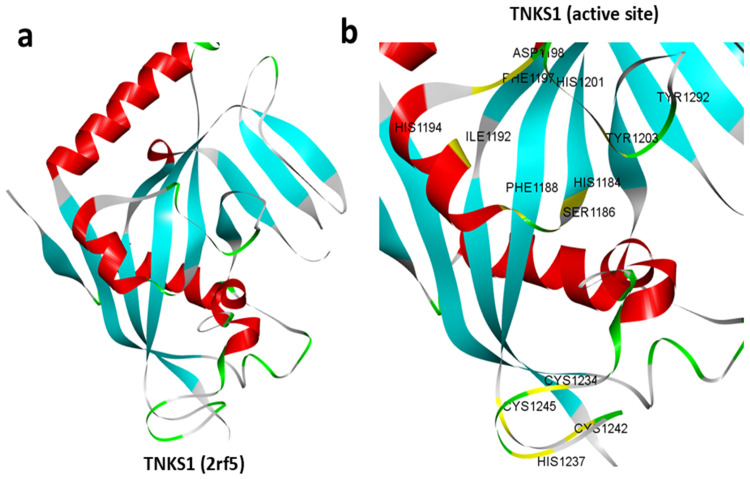
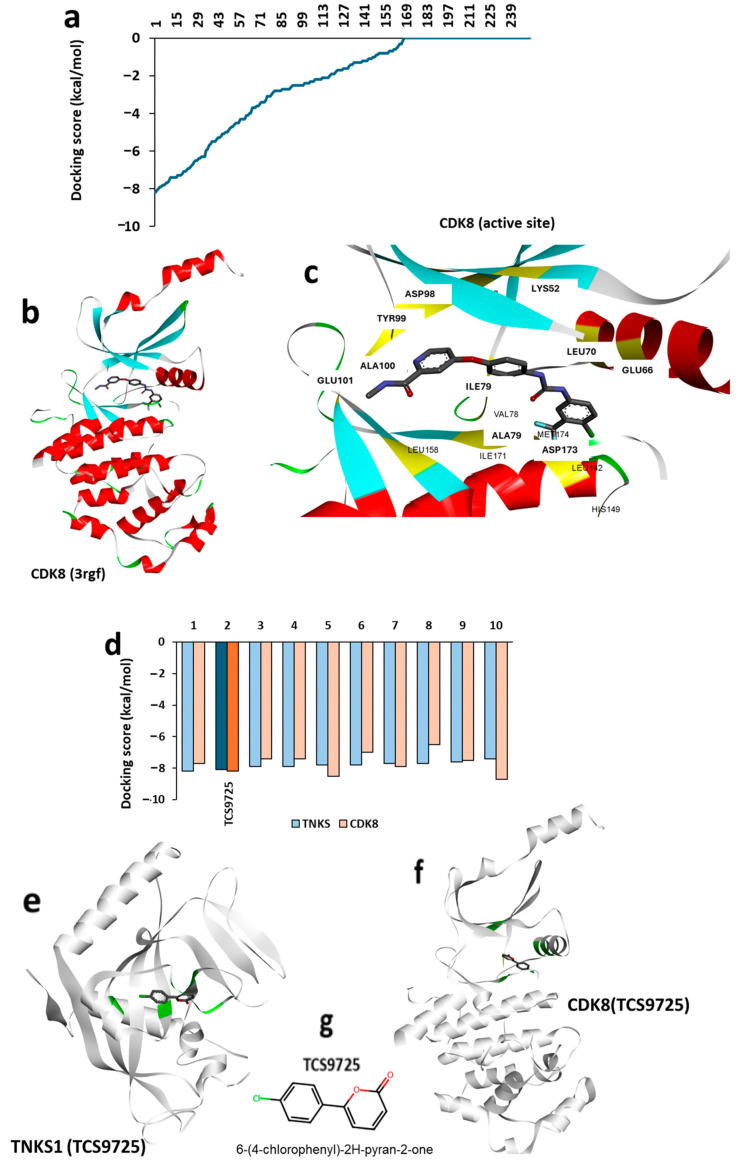
Background: Tankyrase (TNKS1) regulates the WNT/β-catenin pathway, while CDK8 is a transcriptional regulator overexpressed in renal cell carcinoma (RCC). This study aims to identify novel dual inhibitors of tankyrase and Cyclin-dependent kinase 8 (CDK8), utilizing bioinformatics and in vitro methods and to assess their efficiency in renal cancer cells.

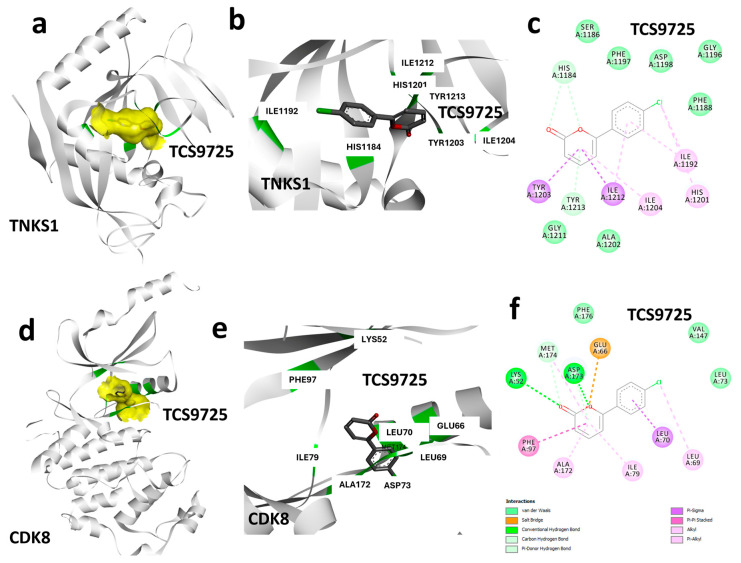
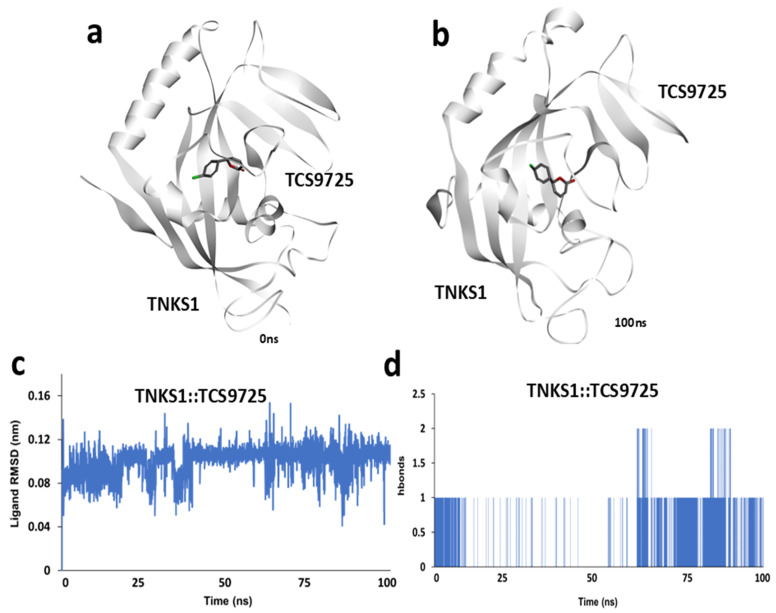
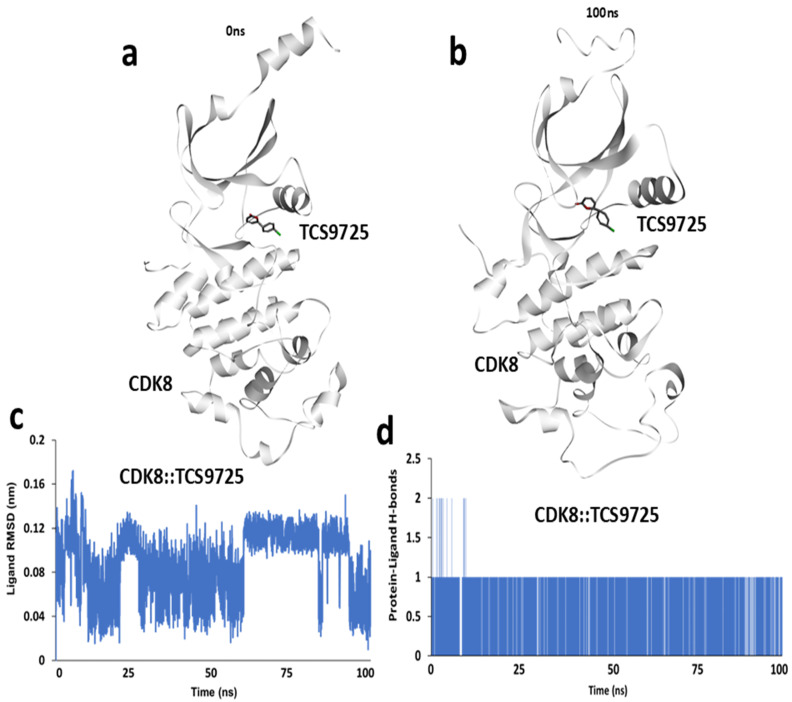
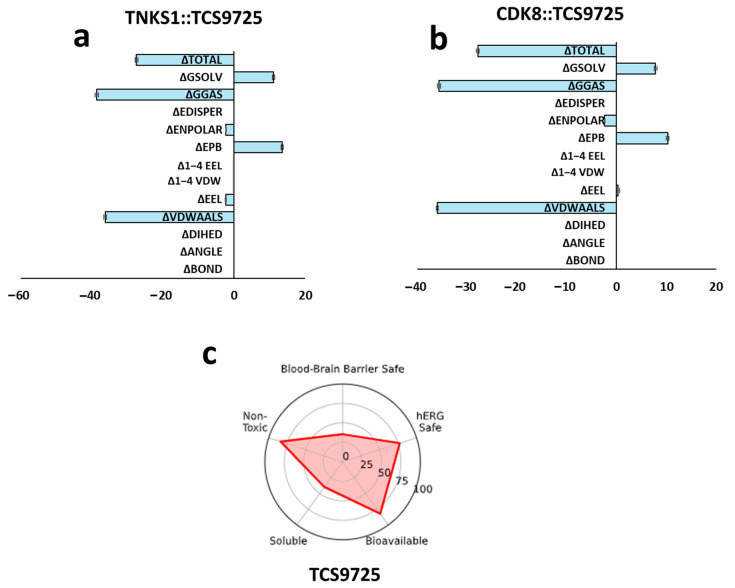
Methods: To identify leads, the ChemBridge library was screening using high-throughput virtual screening (HTVS), which was followed by protein-ligand interaction analysis, Molecular Dynamics (MD) simulation, and Gibbs binding free energy estimation. A-498, Caki-1, and HK-2 cells were employed to validate in vitro efficacy.

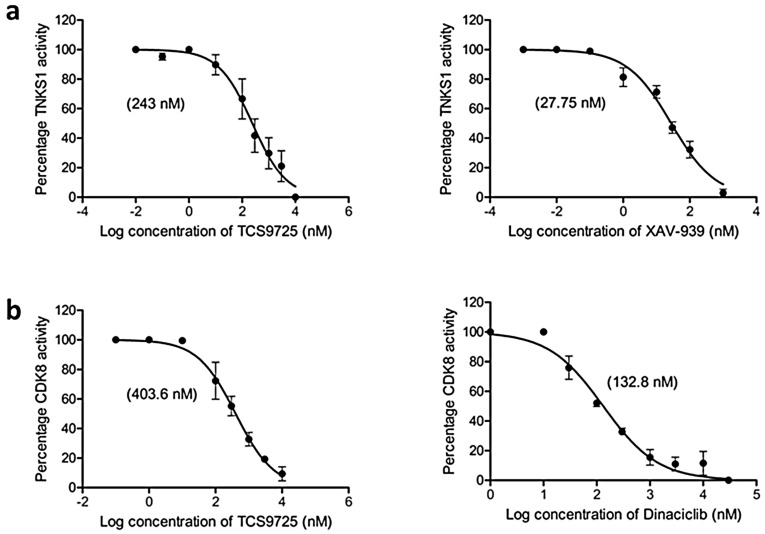
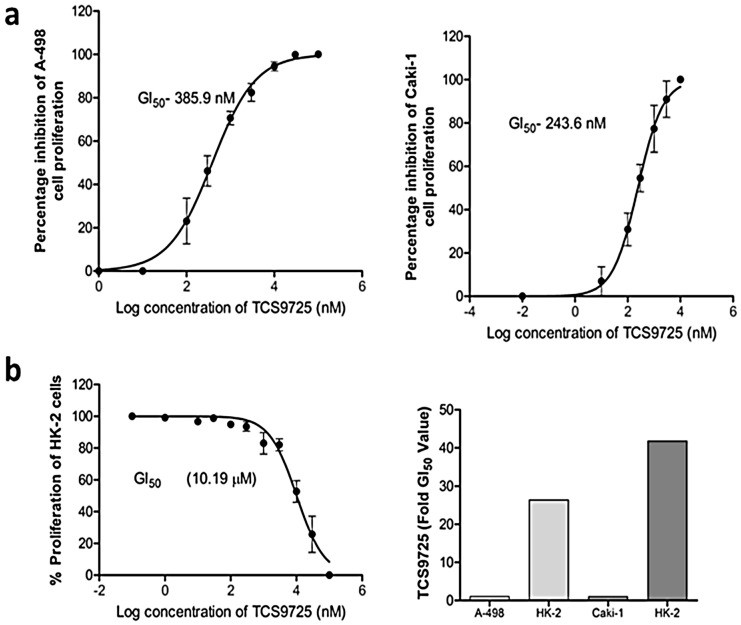
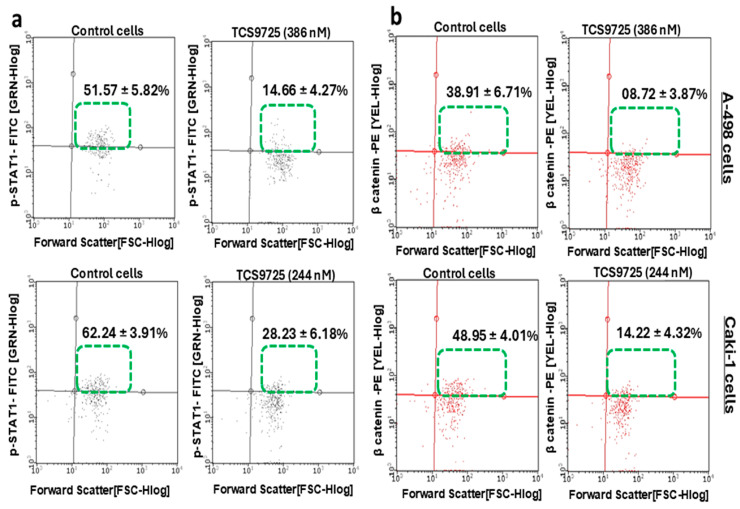
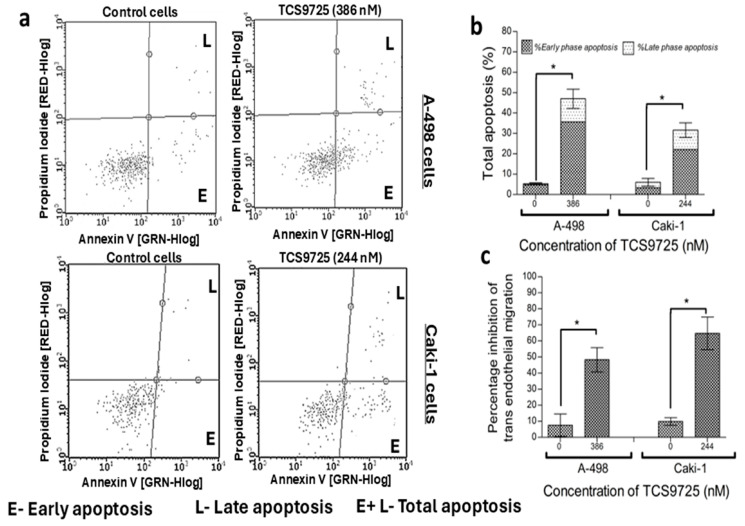
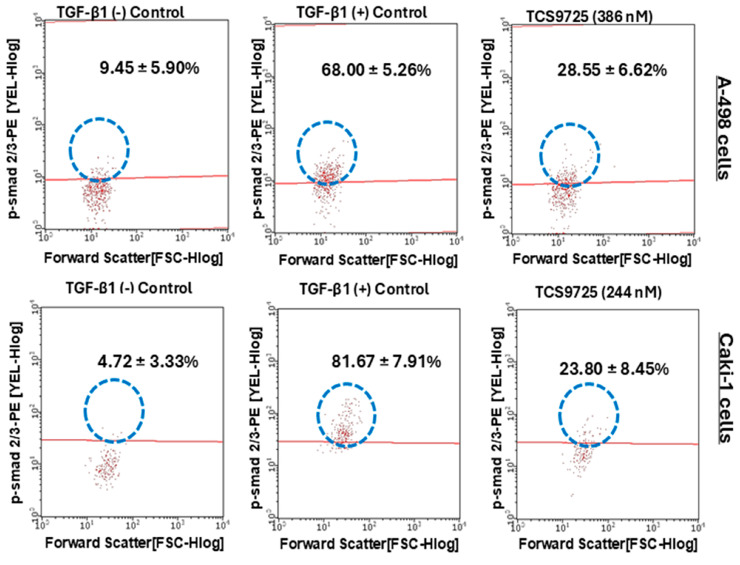
Results: TCS9725 was discovered by HTVS with binding affinities of -8.1 kcal/mol and -8.2 kcal/mol for TNKS1 and CDK8, respectively. TCS9725 had robust binding interactions with root mean square deviation values of 0.00 nm. The ΔG binding estimate was -27.45 for TNKS1 and -27.88 for CDK8, respectively. ADME predictions favored specific small-molecule inhibition profiles. TCS9725 reduced TNKS1 and CDK8 activities with IC50s of 243 nM and 403.6 nM, respectively. The compound efficiently inhibited the growth of A-498 and Caki-1 cells with GI50 values of 385.9 nM and 243.6 nM, respectively, with high selectivity compared to the non-cancerous kidney cells. TCS9725 decreased STAT1 and β-catenin positivity in A-498 and Caki-1 cells. The compound induced apoptosis and reduced TGFβ-stimulated trans-endothelial migration and p-smad2/3 signaling in both RCC cells.

Conclusions: This work provides valuable insights into the therapeutic potential of TCS9725, a dual inhibitor of TNKS1 and CDK8. Further developments of this molecule could lead to new and effective treatments for this devastating disease.

Keywords: CDK8; TNKS1; WNT/β-catenin; dual inhibition; renal cancer.


Conflict of interest statement

The authors declare no conflicts of interest.

Figures

Figure 1
Figure 1
Structure of TNKS1. (a) Three-dimensional representation of the retrieved experimental structure of TNKS1 (2rf5). (b) Retrieved structure of TNKS1 showing active site residues (highlighted in yellow).
Figure 2
Figure 2
High-throughput virtual screening of the ChemBridge library. (a) Based on the D-HTVS method, the histogram representation shows predicted docking scores for the ChemBridge library against the TNKS1 active site. (b) The three-dimensional structure of CDK8 (3rgf) was retrieved from the PDB databank. (c) Cartoon representation highlighting the active site and its associated residues in CDK8 (yellow highlights). (d) Histogram showing docking scores for top 10 molecules from high-throughput virtual screening of top 50 molecules from TNKS1 screening (a), depicting dual interactions. (e) Three-dimensional representation depicting the binding of TCS9725 (top compound) with TNKS1 at its active site. (f) Three-dimensional representation depicting the binding of TCS9725 with CDK8 at its active site kinase domain. (g) Two-dimensional representation of the predicted lead molecule with dual binding property.
Figure 3
Figure 3
Protein–ligand interaction analysis. (a) Molecular surface representation depicting the ligand-binding region in TNKS1. (b) Cartoon representation showing the interactions of TCS9725 at the active site of TNKS1. (c) Two-dimensional representation showing the interactions of TCS9725 along with the nature of bonds. (d) Molecular surface representation depicting the ligand binding region in CDK8. (e) Cartoon representation showing the interactions of TCS9725 at the active site kinase domain of CDK8. (f) Two-dimensional representation showing the interactions of TCS9725 along with the nature of bonds.
Figure 4
Figure 4
Molecular dynamic simulation of TNKS1:: TCS9725 complex. (a) Snapshot of simulation trajectory taken at 0 ns. (b) Snapshot of simulation trajectory taken at 100 ns. (c) Ligand RMSD calculated from 100 ns simulation trajectory and (d) time-course representation of average h-bonds calculated between TNKS1 and TCS9725 from 100 ns simulation trajectory.
Figure 5
Figure 5
Molecular dynamic simulation of CDK8:: TCS9725 complex. (a) Snapshot of simulation trajectory taken at 0 ns. (b) Snapshot of simulation trajectory taken at 100 ns. (c) Ligand RMSD calculated from 100 ns simulation trajectory and (d) time-course representation of average h-bonds calculated between CDK8 and TCS9725 from 100 ns simulation trajectory.
Figure 6
Figure 6
Gibbs binding free energy estimation and ADMET property predictions. (a) Histogram representing MMPBSA results for Gibbs binding free energy estimation from 100 ns trajectory for TNKS1::TCS9725 complex. (b) Histogram representing MMPBSA results for Gibbs binding free energy estimation from 100 ns trajectory for CDK8::TCS9725 complex. (c) Predicted ADMET properties for the lead molecule TCS9725.
Figure 7
Figure 7
TCS9725 inhibited TNKS1 and CDK8 activity. The effect of TCS9725 and standard compounds at various concentrations was evaluated concerning (a) TNKS1 and (b) CDK8 activities and the IC50 values are presented. GraphPad Prism version 6.0 was used to examine the mean ± SD results from three studies.
Figure 8
Figure 8
TCS9725 inhibited the RCC cell proliferations selectively. The antiproliferative activity GI50 values for TCS9725 on (a) A-498 cells and Caki-1 cells are shown. The compound dose-dependently inhibited the proliferation of these cell lines. (b) The effect of TCS9725 on the proliferation of non-cancerous, normal HK-2 kidney cells and the fold difference of the TCS9725’s GI50 value of HK-2 cells versus A-498 cells and Caki-1 cells are presented. GraphPad Prism version 6.0 software was used to examine the mean ± SD values of the percentage of cell proliferation inhibition.
Figure 9
Figure 9
The phospho-STAT-1- and β-catenin-positive population in RCC cells was suppressed by TCS9725. The endogenous phospho-STAT-1(Ser727) population (a) and the β-catenin population (b) were reduced in A-498 and Caki-1 cells by TCS9725 when compared to the respective untreated control cells. Representative graphs are presented. Numerical values are mean ± SD from three individual experiments. Statistical significance at p < 0.05.
Figure 10
Figure 10
Shows the effect of TCS9725 on RCC apoptosis and trans-cell migration. TCS9725 triggered both early-phase and late-phase apoptosis in A-498 and Caki-1 cells after 48 h of treatment. (a) Representative Annexin V test graphs showing TCS9725 inducing early and late apoptosis in A-498 and Caki-1 cells. (b) Histograms showing the effectiveness of TCS9725 in inducing early, late, and total apoptosis in RCC cells. (c) The compound effectively inhibited the migration of A-498 and Caki-1 cells across the HUVEC membrane in the presence of 10 ng/mL TGF-β, a chemoattractant. * p ≤ 0.05 was considered statistically significant. Results were reported as mean ± SD from three experiments.
Figure 11
Figure 11
Effect of TCS9725 on p-smad 2/3 signaling. TGF-β (10 ng/mL) increased the smad2 (pS465/pS467)/smad3 (pS423/pS425)-positive population in A-498 and Caki-1 cells when compared to the TGF-β (−) control. TCS9725 downregulated TGF-β-stimulated phospho smad2/smad3 signaling in A-498 and Caki-1 cells. Representative graphs are depicted. Numerical values are mean ± SD from three individual experiments. Statistical significance at p < 0.05.

Similar articles

References

    1. Padala S.A., Barsouk A., Thandra K.C., Saginala K., Mohammed A., Vakiti A., Rawla P., Barsouk A. Epidemiology of Renal Cell Carcinoma. World J. Oncol. 2020;11:79–87. doi: 10.14740/wjon1279. - DOI - PMC - PubMed
    1. Banumathy G., Cairns P. Signaling pathways in renal cell carcinoma. Cancer Biol. Ther. 2010;10:658–664. doi: 10.4161/cbt.10.7.13247. - DOI - PMC - PubMed
    1. Xu Q., Krause M., Samoylenko A., Vainio S. Wnt Signaling in Renal Cell Carcinoma. Cancers. 2016;8:57. doi: 10.3390/cancers8060057. - DOI - PMC - PubMed
    1. Yip H.Y.K., Papa A. Signaling Pathways in Cancer: Therapeutic Targets, Combinatorial Treatments, and New Developments. Cells. 2021;10:659. doi: 10.3390/cells10030659. - DOI - PMC - PubMed
    1. Matuszczak M., Kiljańczyk A., Salagierski M. Surgical Approach in Metastatic Renal Cell Carcinoma: A Literature Review. Cancers. 2023;15:1804. doi: 10.3390/cancers15061804. - DOI - PMC - PubMed

LinkOut - more resources