. 2025 Jul 23:13:RP100885.
doi: 10.7554/eLife.100885.

Stochastic cell-intrinsic stem cell decisions control colony growth in planarians

Affiliations

Stochastic cell-intrinsic stem cell decisions control colony growth in planarians

Tamar Frankovits et al. Elife. .

Abstract

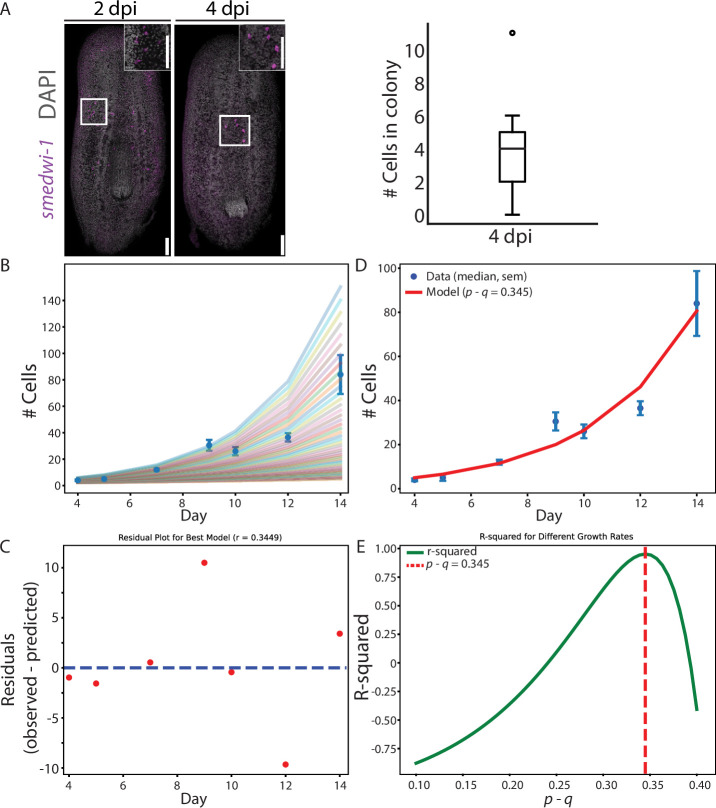
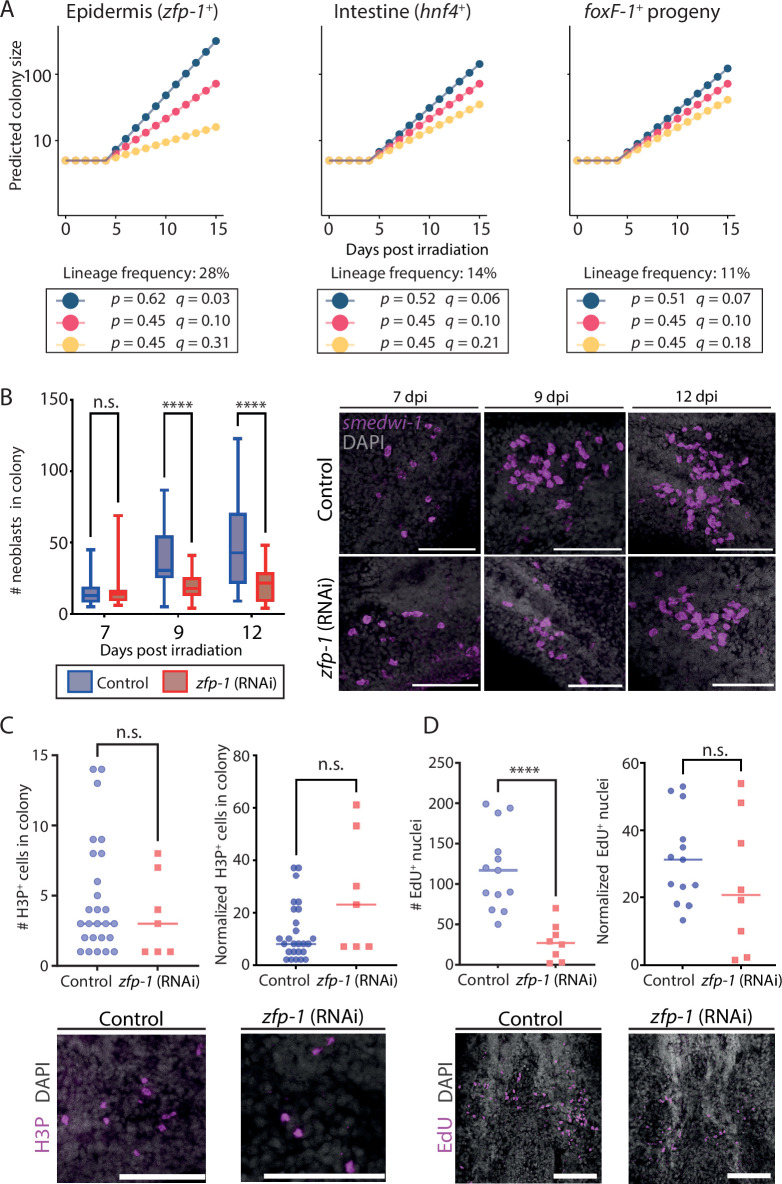
Stem cells contribute to organismal homeostasis by balancing division, self-renewal, and differentiation. Elucidating the strategies by which stem cells achieve this balance is critical for understanding homeostasis and for addressing pathogenesis associated with the disruption of this balance (e.g. cancer). Planarians, highly regenerative flatworms, use pluripotent stem cells called neoblasts to maintain and regrow organs. A single neoblast can rescue an entire animal depleted from stem cells and regenerate all cell lineages. How neoblast differentiation and clonal expansion are governed to produce all the required cell types remains unclear. Here, we integrated experimental and computational approaches to develop a quantitative model revealing basic principles of clonal growth of individual neoblasts. By experimentally suppressing differentiation to major lineages, we elucidated the interplay between colony growth and lineage decisions. Our findings suggest that neoblasts select their progenitor lineage based on a cell-intrinsic fate distribution. Arresting differentiation into specific lineages disrupts neoblast proliferative capacity without inducing compensatory expression of other lineages. Our analysis of neoblast colonies is consistent with a cell-intrinsic decision model that can operate without memory or communication between neoblasts. This simple cell fate decision process breaks down in homeostasis, likely because of the activity of feedback mechanisms. Our findings uncover essential principles of stem cell regulation in planarians, which are distinct from those observed in many vertebrate models. These mechanisms enable robust production of diverse cell types and facilitate regeneration of missing tissues.

Keywords: Schmidtea mediterranea; cell fate decision; developmental biology; neoblast; planarian; regeneration; regenerative medicine; stem cell; stem cells; systems modeling.


Conflict of interest statement

TF, PC, YY, SD, OW No competing interests declared

Figures

Figure 1.
Figure 1.. Potential outcomes of neoblast division and the effect on colony size.
Figure 2.
Figure 2.. Parameters determining neoblast colony size.
(A) Outline of colony growth following subtotal irradiation. Planarians are irradiated to eliminate all neoblasts (purple dots) except for a single survivor. The surviving neoblast forms a proliferating neoblast colony. (B) The impact of average cell cycle length (τ) and probability of symmetric renewal division (p) on colony size is shown (q was set to 0). (C) Reanalysis of BrdU incorporation time series (Lei et al., 2016) in expanding planarian colonies was used for determining the average cell cycle length (Methods). Linear regression (blue line; y=59.77 + 2.81 * t; Pearson r=0.997) was used to identify the doubling time of the colony, and was determined as 29.7 hr (black arrow). (D) The fraction of symmetric renewal divisions was estimated by examining neoblast pairs in colonies at 7 days post-irradiation (dpi) (Methods). Scale = 10 µm. (E) The impact of symmetric differentiation or neoblast elimination (q) on colony size was tested, assuming a 29.7 hr long cell cycle. Experimental data of colony sizes at different time points were overlaid to determine the value of biologically relevant parameters. Frankovits, data collected here; Wagner et al., 2012; Raz, reanalysis (Raz et al., 2021). Error bars show the standard error. (F) Shown are neoblast colonies at three time points following subtotal irradiation. Representative images (z-projection) are shown (top), and neoblast counting of different colonies is shown (bottom; box indicates interquartile range [IQR]; whiskers show range; horizontal bar indicates median). Scale = 100 µm. (G) Summary of the estimated probabilities of divisions leading to symmetric renewal, symmetric differentiation or elimination, and asymmetric divisions.
Figure 2—figure supplement 1.
Figure 2—figure supplement 1.. Analysis of colony growth.
(A) Shown are fluorescence in situ hybridization (FISH) images for detecting neoblasts (smedwi-1+; magenta) at 2 and 4 days post-irradiation (dpi), left and right, respectively. Colonies were not found at 2 dpi, and instead, isolated cells expressing low levels of smedwi-1 were scattered in the planarian parenchyma, likely reflecting remnants of dying neoblasts. At 4 dpi, surviving neoblasts already established spatially isolated clusters of neoblasts detectable as small colonies (median = 4 cells; quantification shown on the right). Scale = 100 µm. (B–E) The effect of different growth parameters on colony size. (B) Shown are colony sizes when considering a range of q values (0.1–0.4) with p set to 0.5. Data collected here and in published analyses of colony sizes (Raz et al., 2021; Wagner et al., 2012) is shown as median (blue dots) and standard error of the mean. (C) Shown is the best predicted fit growth following colony establishment using the exponential growth equation. (D) Analysis of residuals between observed and predicted colony sizes using the best fitting parameters. (E) Shown is the R-squared difference between observed and predicted data at a range of growth parameters. The best R-squared value is indicated by the red dashed line.
Figure 3.
Figure 3.. Reduced neoblast colony size following lineage specification block.
(A) Models for lineage growth. Potential outcomes of lineage inhibitions were assessed by altering the colony growth and degradation parameters. Applying known lineage frequencies (Raz et al., 2021) to the models indicated that inhibiting production of a major lineage could dramatically impact colony size (left, epidermis). By contrast, inhibition of smaller lineages (middle, right) might have a smaller impact, which would be difficult to detect (blue: increase in symmetric renewal; red: unchanged renewal and degradation; yellow: increase in neoblast degradation). Growth was calculated using the following values: N0=5, τ=29.7 hr, and growth lag time of 5 days (Raz et al., 2021; Wagner et al., 2012). (B) Shown are counts (left) of neoblasts in colonies at three time points following irradiation, which was followed by inhibition of zfp-1 or control by RNAi. Lineage inhibition resulted in a highly significant decrease in colony size at later time points (box indicates interquartile range [IQR], whiskers show range, bar indicates the median). Number of control colonies analyzed at 7 days post-irradiation (dpi) n = 28; at 9 dpi n = 30; at 12 dpi n = 30; number of zfp-1 (RNAi) colonies analyzed at 7 dpi n = 15; at 9 dpi n = 30; at 12 dpi n = 30. Representative colonies (z-projection) are shown (right). (C) Comparison of absolute (top-left) or normalized (top-right) H3P+ cell numbers in zfp-1 (RNAi) and control colonies at 12 dpi showed a nonsignificant difference (Methods). Representative H3P labeling images are shown (bottom). Importantly, the number of detectable H3P+ cells was small. (D) Comparison of EdU+ nuclei (top-left) in zfp-1 (RNAi) and control colonies at 12 dpi showed a significant reduction, contributing to the smaller colony size. Comparison of normalized EdU+ nuclei numbers (top-right) showed a nonsignificant difference, indicating that a similar proportion of neoblasts in the colony were cycling (Methods). Representative EdU labeling images (z-projection) are shown (bottom). Statistical significance was assessed using the Mann-Whitney two-tailed test (Methods). n.s., not significant, **** p<0.0001. Scale = 100 µm.
Figure 3—figure supplement 1.
Figure 3—figure supplement 1.. Inhibition of epidermal progenitors by a single zfp-1 dsRNA injection.
Inhibition of zfp-1 resulted in complete ablation of epidermal progenitor production at 7 days post-injection, as observed by labeling animals with the epidermal progenitor marker, prog-2. Scale = 100 µm.
Figure 4.
Figure 4.. Simulation of neoblast colony growth following lineage block.
(A, B) Neoblasts expressing lineage gene expression markers were detected using fluorescence in situ hybridization (FISH) (intestine mix: hnf-4, gata4/5/6, and nkx2.2; tgs-1) and were counted in colonies of control and zfp-1 (RNAi) animals at 12 days post-irradiation (dpi) (Methods). Left panels show confocal images of representative colonies (Methods); quantification of the experiment is shown on the right. Scale = 100 µm. (C) Comparison of colony size in control and in zfp-1 (RNAi) animals 12 dpi showed a highly significant reduction in the size of zfp-1 (RNAi) colonies (Mann-Whitney two-tailed test, **** p<0.0001). Data is also shown in Figure 3B. (D) Summary of colony production in control and zfp-1 (RNAi) animals based on analysis of 64 and 53 control and zfp-1 (RNAi) colonies, respectively, at 12 dpi. Developed: ≥5 neoblasts detected; no colony <5 neoblasts detected. (E) Simulation of colony growth in control and zfp-1 (RNAi) animals, bottom and top, respectively (Methods). Shown are multiple iterations (black dots; n=100 for each condition) of colony size simulation starting at 7 dpi. Experimental data quantifying colony sizes are shown (red dots) next to the corresponding simulation cycle. Box indicates the interquartile range (IQR); whiskers indicate ±1.5 × IQR; values out of the whisker range (outliers) were removed for clarity. (F) Summary of colony production in simulated control and zfp-1 (RNAi) animals based on experimentally determined lineage frequencies, and assuming no memory in division outcome decision. Developed colony: ≥5 neoblasts in the simulation on day 12. (G) Neoblasts were counted in colonies at 12 dpi following the inhibition of intestine progenitors by combined RNAi treatment (hnf-4, gata4/5/6, nkx2.2). Lineage inhibition did not affect colony size (Mann-Whitney two-tailed test, p=0.404; n=13 and 16, control and RNAi animals, respectively). (H) Suppression of intestine lineage did not affect the likelihood of producing colonies (n=21 and 24, control and RNAi animals, respectively). (I, J) Combined suppression of foxF-1 (Scimone et al., 2018) and intestine lineage production resulted in smaller colonies (Mann-Whitney two-tailed test, p=3 × 10⁻⁴) and a significant reduction in the likelihood of producing colonies (Fisher’s exact test two-tailed p=1.8 × 10⁻⁵).
Figure 4—figure supplement 1.
Figure 4—figure supplement 1.. Simulation of colony size following RNAi.
(A) Simulation (gray) and comparison to experimental data (red) of neoblast colonies in control and hnf-4 (RNAi) animals. The simulation indicates that, given the variability in colony size, detecting significant differences in colony size is unlikely for this lineage. Each dot represents a single simulation (gray) or an experimentally determined colony size (red). (B, C) Simulations of colony sizes over six cycles of replication starting approximately at day 7 post-irradiation. (B) Boxplots showing the distribution of colony sizes (horizontal line, median; box, interquartile range [IQR]; vertical line, 99% range). Each dot represents a single simulation. (C) Simulation of colony growth (line) shows growth over time (dot, median; vertical line, IQR). (D) The RNAi efficacy was evaluated through assessment of the viability of fragments obtained from animals following a single feeding of dsRNA that targeted intestine fate-specifying transcription factors (FSTFs) (hnf-4, gata4/5/6, nkx2.2), compared to a non-targeting control dsRNA (unc22). All fragments derived from worms fed with dsRNA targeting intestine FSTFs died within 4 days post-feeding, demonstrating that a single dsRNA feeding induced a robust effect.
Figure 5.
Figure 5.. Analysis of zfp-1 inhibition consequences in homeostasis.
(A) Downregulated genes in FACS-purified S/G2/M neoblasts were overwhelmingly associated with expression in the epidermal lineage and epidermis-specialized (zeta) neoblasts (Cheng et al., 2018; Fincher et al., 2018; van Wolfswinkel et al., 2014). (B) Upregulated genes in FACS-purified S/G2/M neoblasts were largely associated with neuronal and protonephridial specialized gene expression (Fincher et al., 2018). (C) Analysis of upregulated genes of whole tissues following zfp-1 inhibition showed that only a few factors were associated with protonephridia or neurons. (A–C) Heatmaps showing row-scaled gene expression obtained from PLANAtools (Hoffman and Wurtzel, 2023). Blue and yellow, low and high log-fold gene expression difference, respectively. Columns on the right indicate cell type-specific gene expression (Fincher et al., 2018). (D) Counting EdU+ nuclei in unirradiated control and zfp-1 (RNAi) animals. (E) Counting apoptotic cells in unirradiated control and zfp-1 (RNAi) animals (Methods). (F) Counting intestinal progenitors showed an increase in progenitors at later time points, in agreement with the gene expression analysis of zfp-1 (RNAi) of whole tissues. Scale = 100 µm. * p<0.05; ** p<0.01; **** p<0.0001.
Figure 6.
Figure 6.. Model summarizing neoblast colony growth principles.

Update of

  • doi: 10.1101/2024.02.26.582030
  • doi: 10.7554/eLife.100885.1
  • doi: 10.7554/eLife.100885.2

Similar articles

References

    1. Abkowitz JL, Golinelli D, Harrison DE, Guttorp P. In vivo kinetics of murine hemopoietic stem cells. Blood. 2000;96:3399–3405. doi: 10.1182/blood.V96.10.3399. - DOI - PubMed
    1. Adler CE, Sánchez Alvarado A. Types or states? cellular dynamics and regenerative potential. Trends in Cell Biology. 2015;25:687–696. doi: 10.1016/j.tcb.2015.07.008. - DOI - PMC - PubMed
    1. Baguñà J. The planarian neoblast: the rambling history of its origin and some current black boxes. The International Journal of Developmental Biology. 2012;56:19–37. doi: 10.1387/ijdb.113463jb. - DOI - PubMed
    1. Becker KA, Ghule PN, Therrien JA, Lian JB, Stein JL, van Wijnen AJ, Stein GS. Self-renewal of human embryonic stem cells is supported by a shortened G1 cell cycle phase. Journal of Cellular Physiology. 2006;209:883–893. doi: 10.1002/jcp.20776. - DOI - PubMed
    1. Bohr TE, Shiroor DA, Adler CE. Planarian stem cells sense the identity of the missing pharynx to launch its targeted regeneration. eLife. 2021;10:e68830. doi: 10.7554/eLife.68830. - DOI - PMC - PubMed