Oral and Gut Dysbiosis in Migraine: Oral Microbial Signatures as Biomarkers of Migraine
- PMID: 40699951
- PMCID: PMC12221161
- DOI: 10.1212/NXI.0000000000200437
Oral and Gut Dysbiosis in Migraine: Oral Microbial Signatures as Biomarkers of Migraine
Abstract
Background and objectives: Emerging evidence suggests that oral health conditions may exacerbate migraine, and saliva is a potential source of biomarkers for migraine. The 3-way interaction of the oral-gut-brain axis has been implicated in several neurologic disorders, but has rarely been studied in migraine. This study examined the oral and gut microbiomes simultaneously and identified several key oral microbes that may influence migraine.
Methods: In this cross-sectional case-control study, participants were divided into 3 groups: episodic migraine (n = 55), chronic migraine (n = 55), and healthy control (HC) (n = 55). Demographic and clinical characteristics; lifestyle factors; and biological samples including saliva, stool, and blood were collected. Composition, function, and community type of the oral and gut microbiomes were compared among the 3 groups.
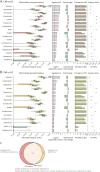
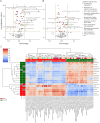
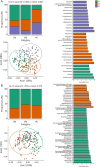
Results: Oral dysbiosis was more pronounced than gut dysbiosis in the migraine groups, with 13 oral genera significantly enriched or depleted compared with HCs. The migraine groups showed increased abundance of Gemella, Streptococcus, Granulicatella, and Rothia and decreased abundance of Alloprevotella, Veillonella, Haemophilus, Selenomonas, Campylobacter, Cardiobacterium, Megasphaera, and Kingella after adjustment for demographic and lifestyle factors including diet. The enriched oral genera within the migraine groups were associated with carbohydrate metabolic pathways, whereas the depleted oral genera were associated with pathways related to nitrogen. A significant proportion of the oral microbial signatures of migraine included genera capable of reducing nitrate and/or nitrite. Some of these oral microbial signatures of migraine had a relative abundance that was positively or negatively associated with the number of headache days per 30 days and formed distinct microbial clusters in both the oral cavity and gut. Machine learning classifiers using the oral microbiome effectively classified migraine status, with an area under the receiver-operating characteristic curve of 0.83-0.88.
Discussion: Our findings suggest that oral dysbiosis may be involved in the development of migraine and highlight specific oral microbes as potential diagnostic biomarkers and therapeutic targets for migraine.
Conflict of interest statement
Y. Jung and H.-S. Oh are employees of CJ Bioscience Inc. M.K. Chu was a site investigator for a multicenter trial sponsored by Biohaven Pharmaceuticals, Allergan Korea, and Ildong Pharmaceutical Company. M.K. Chu received lecture honoraria from Eli Lilly and Company, Handok-Teva, and Ildong Pharmaceutical Company over the past 24 months. M.K. Chu received grants from Yonsei University College of Medicine (6-2021-0229) and the Korea Health Industry Development Institute (KHIDI) (HV22C0106) and a National Research Foundation of Korea (NRF) grant from the Korean government (MSIT) (2022R1A2C1091767). The other authors report no competing interests. Go to
Figures


References
-
- GBD 2016 Disease and Injury Incidence and Prevalence Collaborators. Global, regional, and national incidence, prevalence, and years lived with disability for 328 diseases and injuries for 195 countries, 1990-2016: a systematic analysis for the Global Burden of Disease Study 2016. Lancet. 2017;390:1211-1259. doi: 10.1016/S0140-6736(17)32154-2 - DOI - PMC - PubMed
MeSH terms
Substances
LinkOut - more resources
Full Text Sources
Medical
