

Systematic Comparison of Different Compartmental Models for Predicting COVID-19 Progression
- PMID: 40700105
- PMCID: PMC12286127
- DOI: 10.3390/epidemiologia6030033
Systematic Comparison of Different Compartmental Models for Predicting COVID-19 Progression
Abstract
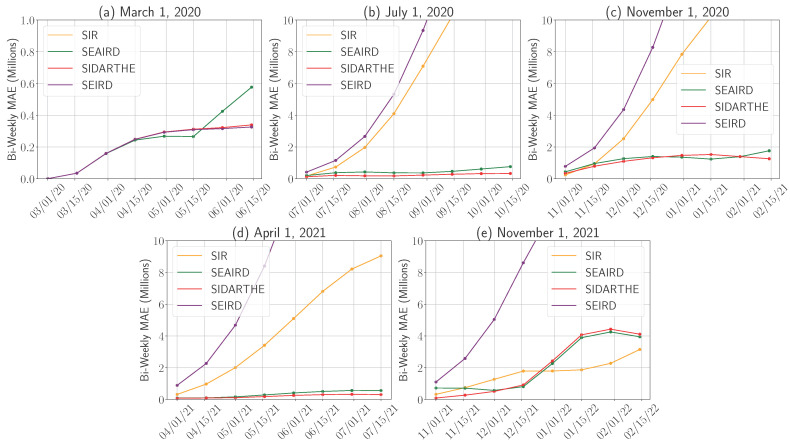
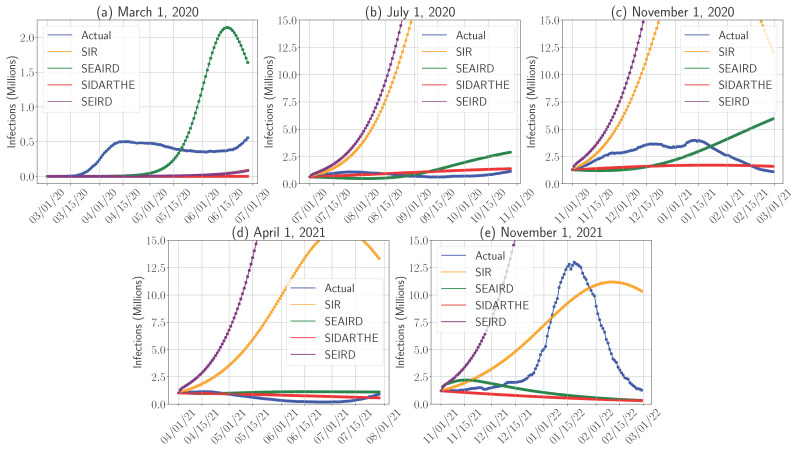
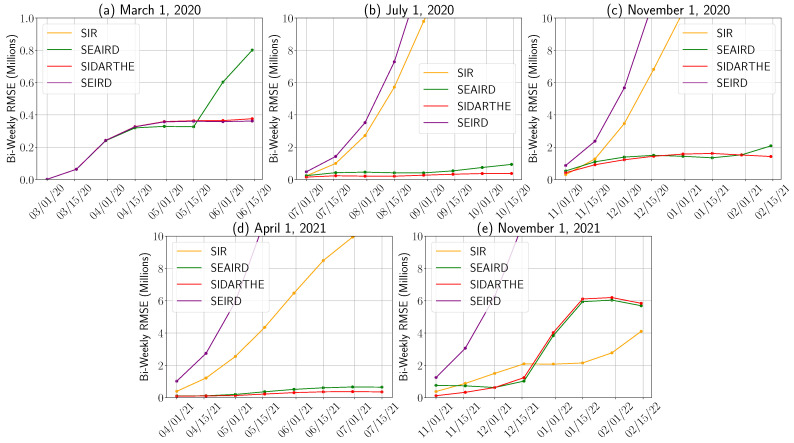
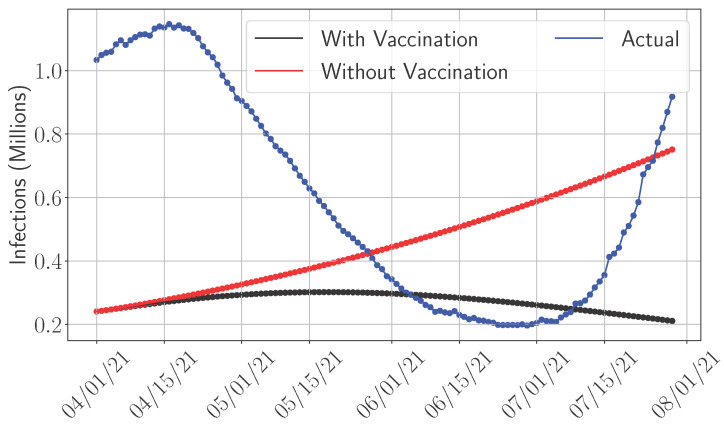
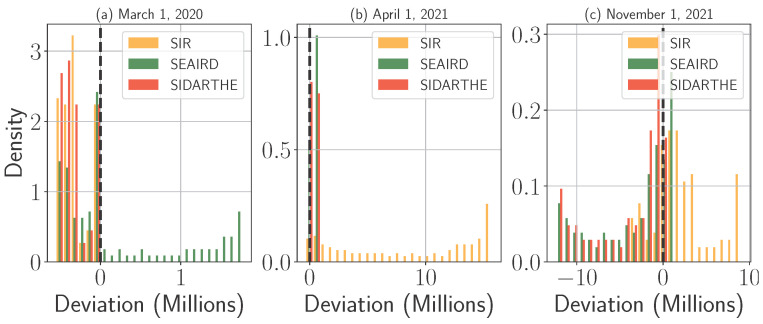
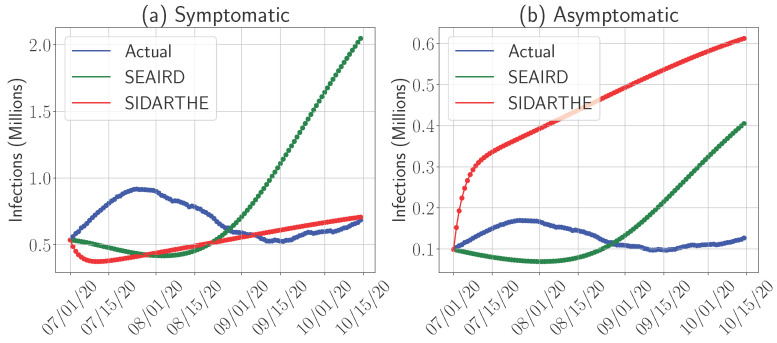
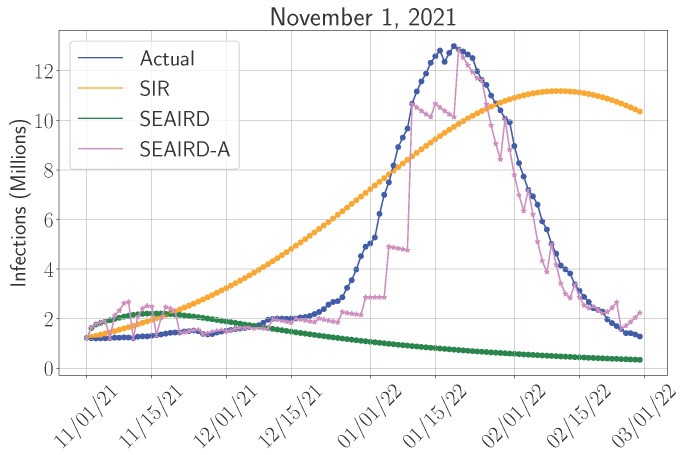
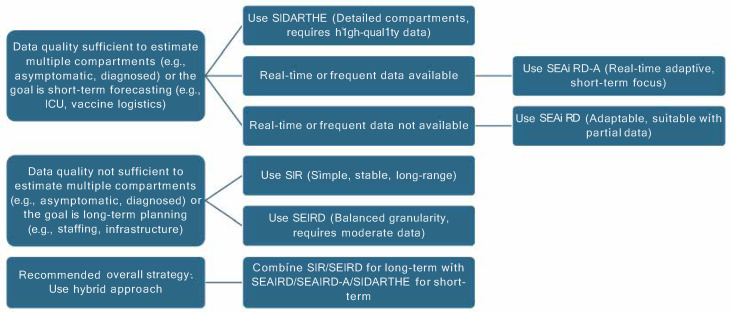
Background/Objectives: The COVID-19 pandemic highlighted the critical need for accurate predictive models to guide public health interventions and optimize healthcare resource allocation. This study evaluates how the complexity of compartmental infectious disease models influences their forecasting accuracy and utility for pandemic resource planning. Methods: We analyzed a range of compartmental models, including simple susceptible-infected-recovered (SIR) models and more complex frameworks incorporating asymptomatic carriers and deaths. These models were calibrated and tested using real-world COVID-19 data from the United States to assess their performance in predicting symptomatic and asymptomatic infection counts, peak infection timing, and resource demands. Both adaptive models (updating parameters with real-time data) and non-adaptive models were evaluated. Results: Numerical results show that while more complex models capture detailed disease dynamics, simpler models often yield better forecast accuracy, especially during early pandemic stages or when predicting peak infection periods. Adaptive models provided the most accurate short-term forecasts but required substantial computational resources, making them less practical for long-term planning. Non-adaptive models produced stable long-term forecasts useful for strategic resource allocation, such as hospital bed and ICU planning. Conclusions: Model selection should align with the pandemic stage and decision-making horizon. Simpler models are effective for rapid early-stage interventions, adaptive models excel in short-term operational forecasting, and non-adaptive models remain valuable for long-term resource planning. These findings can inform policymakers on selecting appropriate modeling approaches to improve pandemic response effectiveness.
Keywords: COVID-19 pandemic; compartmental models; disease progression; epidemic forecasting; healthcare preparedness; prediction accuracy.
Conflict of interest statement
The authors declare no conflicts of interest.
Figures
Similar articles
-
Signs and symptoms to determine if a patient presenting in primary care or hospital outpatient settings has COVID-19.Cochrane Database Syst Rev. 2022 May 20;5(5):CD013665. doi: 10.1002/14651858.CD013665.pub3. Cochrane Database Syst Rev. 2022. PMID: 35593186 Free PMC article.
-
Measures implemented in the school setting to contain the COVID-19 pandemic.Cochrane Database Syst Rev. 2022 Jan 17;1(1):CD015029. doi: 10.1002/14651858.CD015029. Cochrane Database Syst Rev. 2022. Update in: Cochrane Database Syst Rev. 2024 May 2;5:CD015029. doi: 10.1002/14651858.CD015029.pub2. PMID: 35037252 Free PMC article. Updated.
-
Rapid, point-of-care antigen tests for diagnosis of SARS-CoV-2 infection.Cochrane Database Syst Rev. 2022 Jul 22;7(7):CD013705. doi: 10.1002/14651858.CD013705.pub3. Cochrane Database Syst Rev. 2022. PMID: 35866452 Free PMC article.
-
Comparison of Two Modern Survival Prediction Tools, SORG-MLA and METSSS, in Patients With Symptomatic Long-bone Metastases Who Underwent Local Treatment With Surgery Followed by Radiotherapy and With Radiotherapy Alone.Clin Orthop Relat Res. 2024 Dec 1;482(12):2193-2208. doi: 10.1097/CORR.0000000000003185. Epub 2024 Jul 23. Clin Orthop Relat Res. 2024. PMID: 39051924
-
Are Current Survival Prediction Tools Useful When Treating Subsequent Skeletal-related Events From Bone Metastases?Clin Orthop Relat Res. 2024 Sep 1;482(9):1710-1721. doi: 10.1097/CORR.0000000000003030. Epub 2024 Mar 22. Clin Orthop Relat Res. 2024. PMID: 38517402
References
-
- Bertsimas D., Boussioux L., Cory-Wright R., Delarue A., Digalakis V., Jacquillat A., Kitane D.L., Lukin G., Li M., Mingardi L., et al. From predictions to prescriptions: A data-driven response to COVID-19. Health Care Manag. Sci. 2021;24:253–272. doi: 10.1007/s10729-020-09542-0. - DOI - PMC - PubMed
-
- Kermack W.O., McKendrick A.G. A contribution to the mathematical theory of epidemics. Proc. R. Soc. Lond. Ser. A Contain. Pap. Math. Phys. Character. 1927;115:700–721.
LinkOut - more resources
Full Text Sources
