. 2025 Jul 16;6(3):65.
doi: 10.3390/neurosci6030065.

Meta-Analysis of Gene Expression in Bulk-Processed Post-Mortem Spinal Cord from ALS Patients and Normal Controls

Affiliations

Meta-Analysis of Gene Expression in Bulk-Processed Post-Mortem Spinal Cord from ALS Patients and Normal Controls

William R Swindell. NeuroSci. .

Abstract

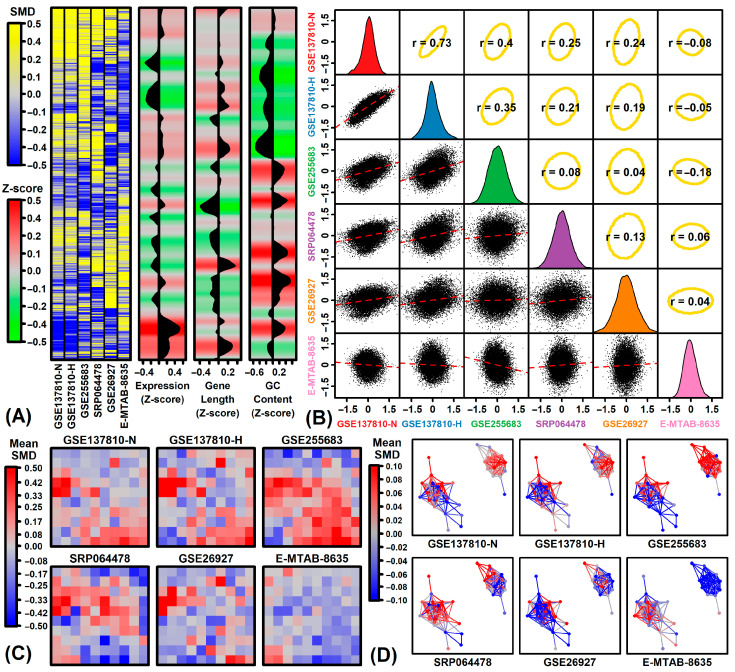
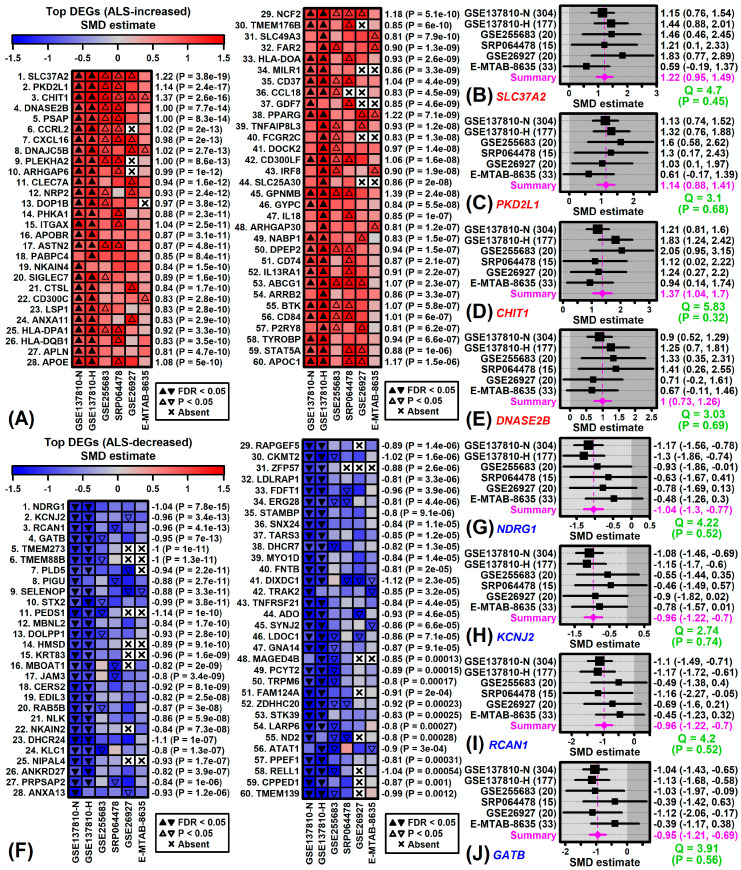
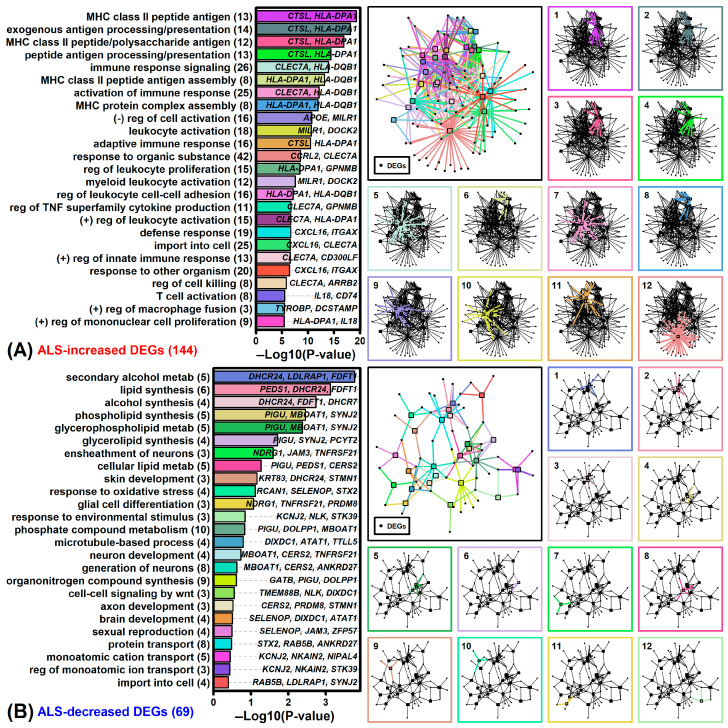
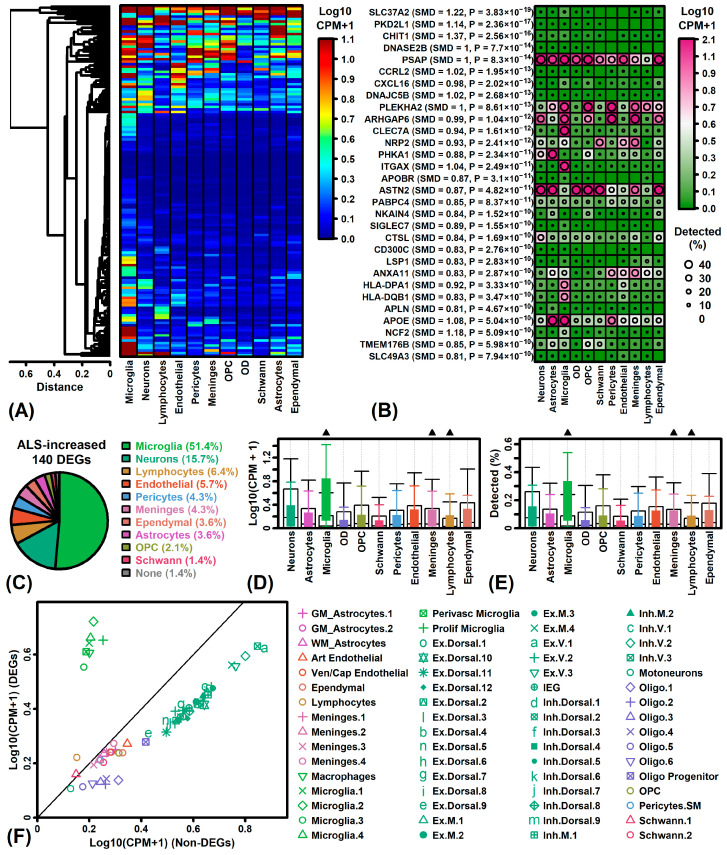
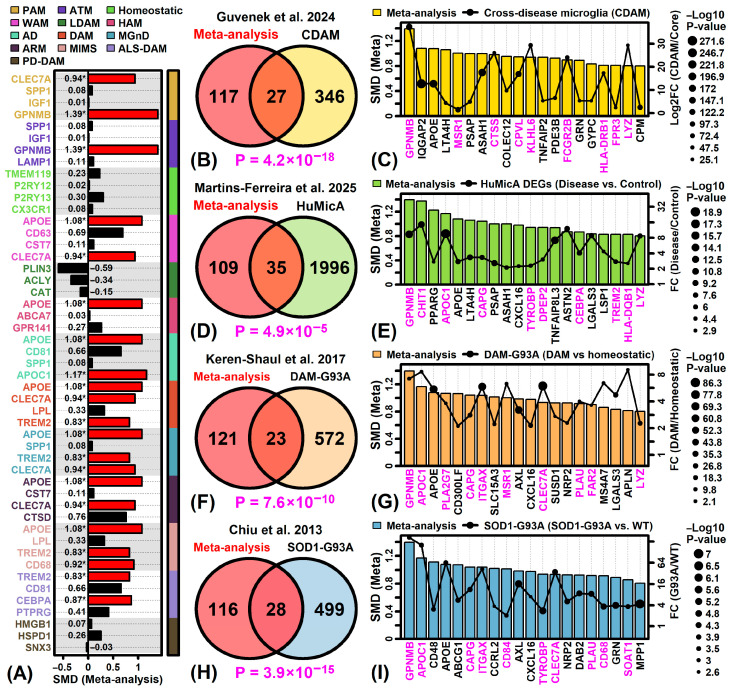
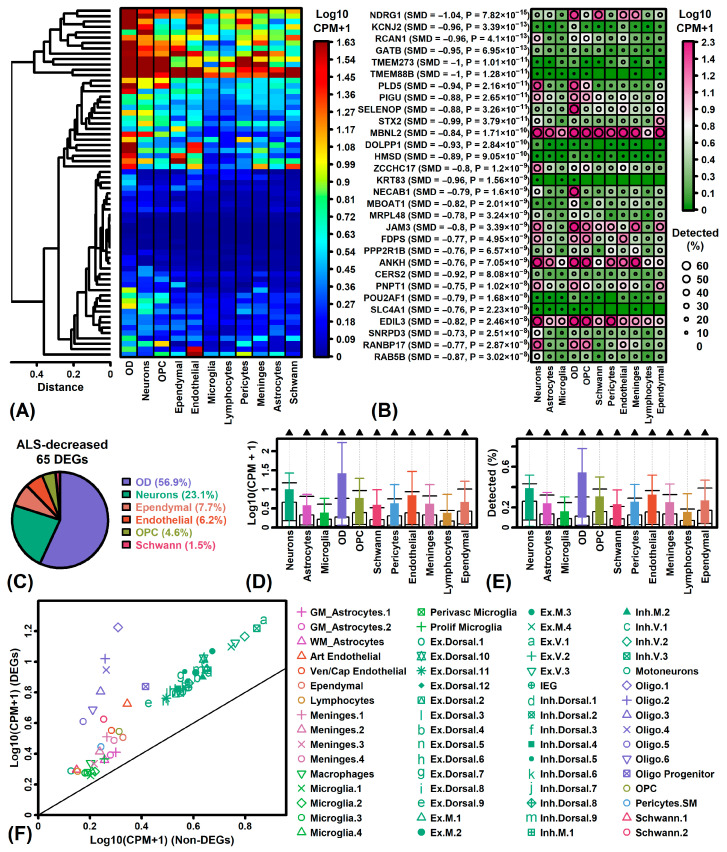
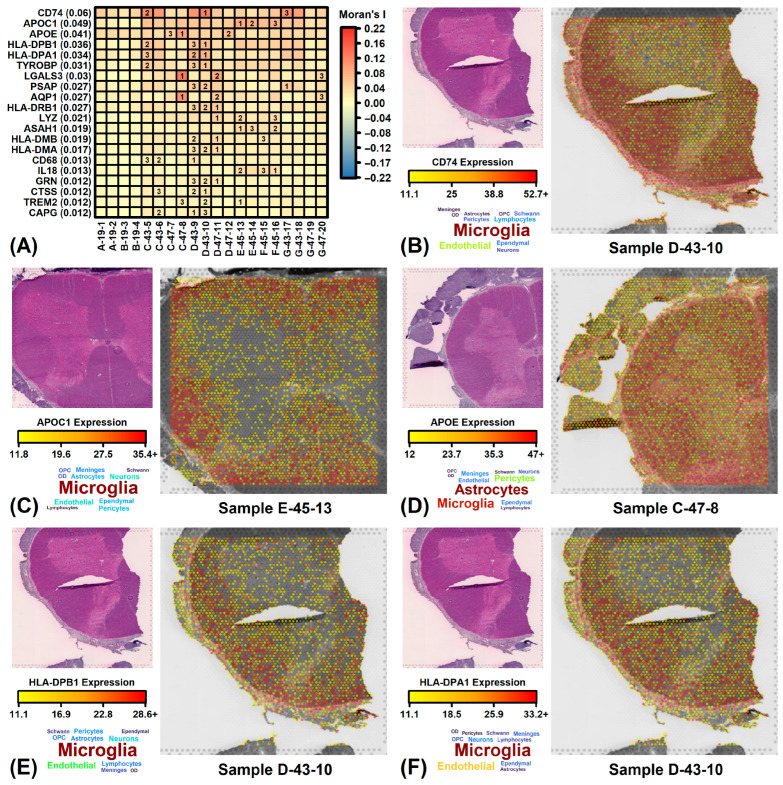
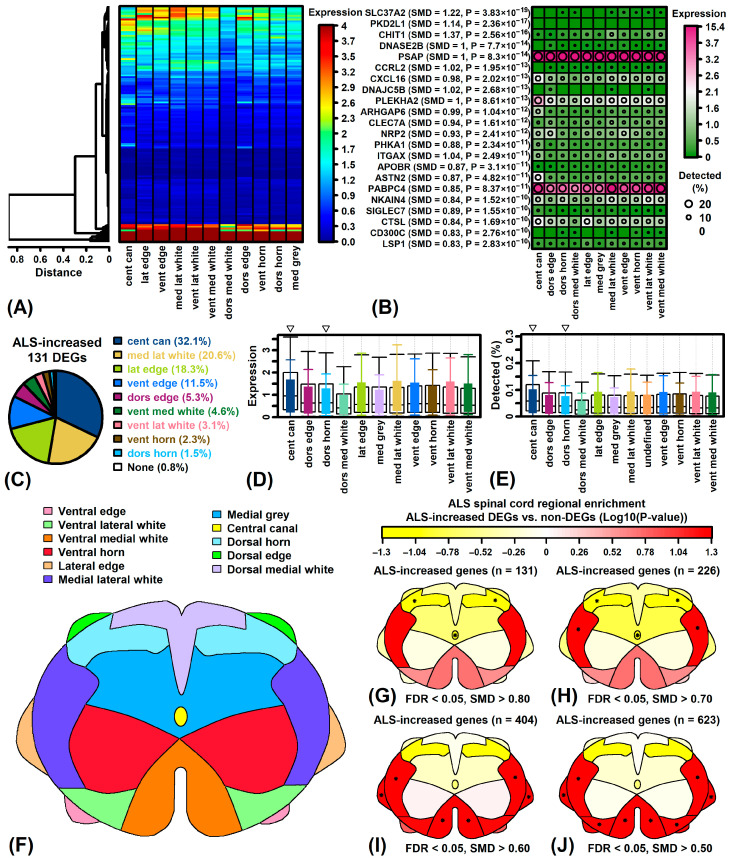
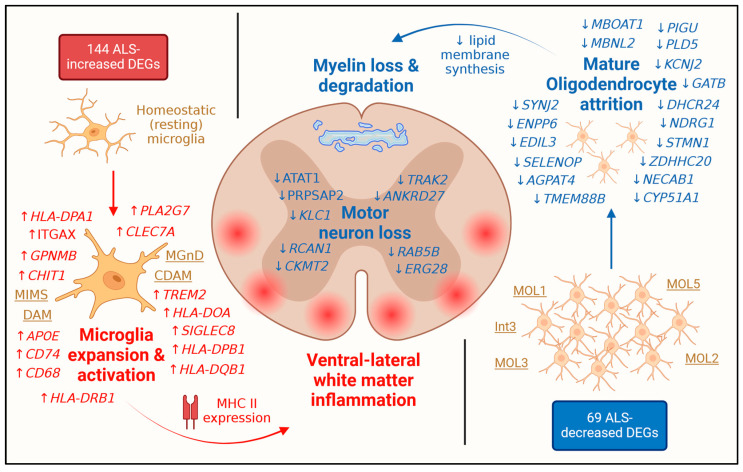
Amyotrophic lateral sclerosis (ALS) is characterized by upper and lower motor neuron failure and poor prognosis. This study performed a meta-analysis of gene expression datasets that compared bulk-processed post-mortem spinal cord from ALS and control (CTL) patients. The analysis included 569 samples (454 ALS, 115 CTL) from 348 individuals (262 ALS, 86 CTL). Patterns of differential expression bias, related to mRNA abundance, gene length and GC content, were discernable from individual studies but attenuated by meta-analysis. A total of 213 differentially expressed genes (DEGs) were identified (144 ALS-increased, 69 ALS-decreased). ALS-increased DEGs were most highly expressed by microglia and associated with MHC class II, immune response and leukocyte activation. ALS-decreased DEGs were abundantly expressed by mature oligodendrocytes (e.g., the MOL5 phenotype) and associated with myelin production, plasma membrane and sterol metabolism. Comparison to spatial transcriptomics data showed that DEGs were prominently expressed in white matter, with increased DEG expression strongest in the ventral/lateral white matter. These results highlight white matter as the spinal cord region most strongly associated with the shifts in mRNA abundance observed in bulk-processed tissues. These shifts can be explained by attrition of mature oligodendrocytes and an ALS-emergent microglia phenotype that is partly shared among neurodegenerative conditions.

Keywords: RNA-seq; microglia; motor neuron disease; neuromuscular; oligodendrocyte; spatial transcriptomics.


Conflict of interest statement

The author declares no conflicts of interest.

Figures

Figure 1
Figure 1
SMD estimates. (A) Clustered heatmap. SMD estimates from each experiment are shown in the blue–yellow heatmap. Rows (genes) have been ordered using hierarchical cluster analysis with average linkage and the Euclidean distance metric. Z-scores corresponding to gene characteristics are shown on the right (i.e., relative mRNA abundance, gene length, GC content). Black regions outline the z-score trend across genes based on a loess curve fit (horizontal axis). (B) SMD correlations between experiments. Diagonal: Distribution of SMD estimates from each experiment. Below-diagonal: SMD scatterplots with each point representing an individual gene (red line: least square regression fit). Above-diagonal: Ellipses outline the middle 90% of genes (based on Mahalanobis distance). Spearman rank correlation estimates are shown (center of each ellipse). (C) Self-organizing map (SOM). An SOM was generated by assigning genes to locations within the square space, based on the similarity of expression patterns in an independent RNA-seq dataset generated from a broad range of human tissue and cell line samples (GSE138734). The SOM was then color-coded based on the average of SMD estimates among genes assigned to each SOM sub-region for each experiment. (D) Module network. A network was generated using an independent tissue atlas dataset (GSE138734). Hierarchical clustering was used to assign genes to each node representing a gene expression cluster (≥100 genes). Connections are drawn between nodes having correlated centroids (r > 0.90). Node layout was determined based upon the Kamada-Kawai algorithm. Nodes are color-coded based upon the average SMD among genes assigned to that node (see scale). Likewise, connections are color-coded based upon the average SMD among genes assigned to both nodes (see scale).
Figure 2
Figure 2
ALS-increased and ALS-decreased DEGs (meta-analysis). (A) Top ALS-increased DEGs (ranked by p-value). Heatmaps are color-coded based on experiment-specific SMD estimates. (B) SLC37A2 forest plot. (C) PKD2L1 forest plot. (D) CHIT1 forest plot. (E) DNASE2B forest plot. (F) Top ALS-decreased DEGs (ranked by p-value). Heatmaps are color-coded based on experiment-specific SMD estimates. (G) NDRG1 forest plot. (H) KCNJ2 forest plot. (I) RCAN1 forest plot. (J) GATB forest plot. In (BE,GJ), SMD estimates from each experiment are shown with meta-estimate (bottom). The total number of samples from each experiment is shown (left margin parentheses) along with the SMD point estimate and confidence interval (right margin). The heterogeneity test statistic (Cochran’s Q) is shown with p-value (bottom-right).
Figure 3
Figure 3
GO BP terms. (A) GO BP terms enriched among ALS-increased DEGs (SMD ≥ 0.80, FDR < 0.05). (B) GO BP terms enriched among ALS-decreased DEGs (SMD ≤ -0.80, FDR < 0.05). In (A) and (B), bar charts (left) show the level of enrichment for the 25 top-ranked GO BP terms (exemplar genes listed within each figure). The degree of enrichment (horizontal axis) is proportional to the -log10-transformed p-value (conditional hypergeometric test for enrichment). The number of DEGs associated with each GO BP term is listed in parentheses (left margin). A color-coded network of the top 25 GO BP terms is shown (right) for both (A) increased and (B) decreased DEGs. Networks were generated using the Kamada-Kawai algorithm and show connections between GO BP terms (squares) and DEGs (circles). In the larger network (top-left), connections between GO BP terms and DEGs are color-coded (see bar chart colors on left). Smaller networks show only color-coded connections between DEGs and one of the 12 top-ranked GO BP terms (rank shown in upper-left).
Figure 4
Figure 4
ALS-increased DEGs and their expression in human spinal cord cell types (GSE190442). (A) Cluster analysis. The heatmap shows average expression of ALS-increased DEGs across 11 cell type categories. DEGs have been hierarchically clustered using average linkage and the Euclidean distance. (B) Top-ranked ALS-increased DEGs. The heatmap shows top ALS-increased DEGs and their average expression across 11 cell type categories. The heatmap color corresponds to average expression and circles indicate the percentage of nuclei with detectable expression. (C) Percentage of DEGs assigned to each cell type category. ALS-increased DEGs were assigned to the cell type category for which average expression was highest. (D) Expression level of DEGs versus non-DEGs by cell type category. (E) Percentage of nuclei with detectable expression in DEGs versus non-DEGs by cell type category. In (D,E), boxes outline the middle 50% of values (whiskers: 10th to 90th percentiles). Clear boxes (background) correspond to non-DEGs whereas colored boxes correspond to DEGs. Filled triangles (top margin) denote cases in which DEG expression is significantly greater than non-DEGs (up-triangles) or significantly less than non-DEGs (down-triangles) (Wilcoxon rank sum test, FDR < 0.05). (F) Average expression of DEGs versus non-DEGs by cell type sup-population. A different symbol is used for each sub-population whereas all sub-populations within the same category share the same color.
Figure 5
Figure 5
Microglia signature genes. (A) Microglia phenotypes and marker genes. SMD estimates are shown for marker genes associated with homeostatic microglia and 12 other phenotypes (PAM: proliferative associated microglia; ATM: axon tract associated microglia; WAM: white matter associated microglia; LDAM: lipid droplet accumulating microglia; HAM: human AD microglia; AD: AD microglia; DAM: disease associated microglia; MGnD: microglia neurodegenerative phenotype; ARM: activated response microglia; MIMS: microglia inflamed in MS; ALS-DAM: disease associated microglia in ALS; PD-DAM: disease associated microglia in Parkinson’s disease). ALS-increased DEGs are indicated by red bars with an asterisk (*) (FDR < 0.05 with SMD > 0.80). Microglia marker genes were previously reported by [82]. (B,D,F,H) Venn diagrams. Overlap is shown between meta-analysis ALS-increased DEGs and microglia-associated genes. p-values (bottom) were generated using Fisher’s exact test. (C,E,G,H) ALS-increased DEGs associated with Venn diagram overlap regions. Gene labels with magenta font are expressed more highly in microglia than any other spinal cord cell type (based on snRNA-seq data, GSE222322). Bars denote meta-analysis SMD estimates (left axis). Black circles represent effect size estimates (right axis) and p-values (see legend) reported by primary study authors. In (B,C), ALS-increased DEGs are compared to genes within the cross-disease-associated microglia (CDAM) cluster (see Table S4 from [83]). In (D,E) ALS-increased DEGs are compared to genes having higher expression in microglia from patients with neurological disease relative to control individuals in Human Microglia Atlas (HuMicA) samples (see Supplementary Data 6 from [84]). In (F,G), ALS-increased DEGs are compared to those having higher expression in DAM versus homeostatic microglia cell populations from SOD1-G93A mouse spinal cords (see Table S6 from [85]). In (H,I), ALS-increased DEGs are compared to genes having elevated expression in SOD1-G93A microglia (endstage phenotype) compared to wild type microglia (see Table S3 from [86]).
Figure 6
Figure 6
ALS-decreased DEGs and their expression in human spinal cord cell types (GSE190442). (A) Cluster analysis. The heatmap shows the average expression of ALS-decreased DEGs across 11 cell type categories. DEGs have been hierarchically clustered using average linkage and the Euclidean distance. (B) Top-ranked ALS-decreased DEGs. The heatmap shows top ALS-decreased DEGs and their average expression across 11 cell type categories. The heatmap color corresponds to the average expression and circles indicate the percentage of nuclei with detectable expression. (C) Percentage of DEGs assigned to each cell type category. ALS-decreased DEGs were assigned to the cell type category for which average expression was highest. (D) Expression level of DEGs versus non-DEGs by cell type category. (E) Percentage of nuclei with detectable expression in DEGs versus non-DEGs by cell type category. In (D,E), boxes outline the middle 50% of values (whiskers: 10th to 90th percentiles). Clear boxes (background) correspond to non-DEGs whereas colored boxes correspond to DEGs. Filled triangles (top margin) denote cases in which DEG expression is significantly greater than non-DEGs (up-triangles) or significantly less than non-DEGs (down-triangles) (Wilcoxon rank sum test, FDR < 0.05). (F) Average expression of DEGs versus non-DEGs by cell type sup-population. A different symbol is used for each sub-population whereas all sub-populations within the same category share the same color.
Figure 7
Figure 7
ALS-increased DEGs with high spatial heterogeneity in normal human spinal cord (GSE222322). (A) Moran’s I statistic. The heatmap shows ALS-increased DEGs with the highest average Moran’s I statistic across 20 tissue sections (10x Genomics Visium array). The average Moran’s I statistic is listed in parentheses for each gene (left margin). The top 3 samples with the highest Moran’s I statistic for each gene are indicated in each row. (B) CD74 expression (sample D-43-10). (C) APOC1 expression (sample E-45-13). (D) APOE expression (sample C-47-8). (E) HLA-DPB1 expression (sample D-43-10). (F) HLA-DPA1 expression (sample D-43-10). In (BF), the raw H&E image is shown (upper left) alongside the same image overlaid with spots color-coded based upon gene expression (see scale). Colors indicate expression of the gene based upon SCT-normalized expression values scaled to the [0, 100] interval. The word cloud (bottom left) indicates average expression of the gene among spinal cord cell types, with larger font sizes used to denote cell types having relatively higher expression of the indicated gene.
Figure 8
Figure 8
ALS-increased DEGs and their regional expression in ALS patient cervical/lumbar cord segments [44]. (A) Cluster analysis. The heatmap shows the average expression of ALS-increased DEGs across 11 spinal cord regions. DEGs have been hierarchically clustered using average linkage and the Euclidean distance. (B) Top-ranked ALS-increased DEGs. The heatmap shows top ALS-increased DEGs and their average expression across 11 spinal cord regions. The heatmap color corresponds to average expression and circles indicate the percentage of regional spots with detectable expression. (C) Percentage of DEGs assigned to each spinal cord region. ALS-increased DEGs were assigned to the region for which average expression was highest. (D) Expression level of DEGs versus non-DEGs by region. (E) Percentage of regional spots with detectable expression among DEGs versus non-DEGs. In (D,E), boxes outline the middle 50% of values (whiskers: 10th to 90th percentiles). Clear boxes (background) correspond to non-DEGs whereas colored boxes correspond to DEGs. Open triangles (top margin) denote cases in which DEG expression is significantly greater than non-DEGs (up-triangles) or significantly less than non-DEGs (down-triangles) (Wilcoxon rank sum test, p < 0.05). (F) Spinal cord regions (see legend). (GJ) Relative enrichment of DEG expression by region. Analyses were performed using ALS-increased genes (FDR < 0.05) with SMD > 0.80 (G), SMD > 0.70 (H), SMD > 0.60 (I) and SMD > 0.50 (J). The number of genes analyzed is indicated for each case (top margin). For each region, expression of DEGs was compared to non-DEGs (Wilcoxon rank sum test) and colors reflect the Log10(p-value) obtained in each comparison (greater than zero if DEG expression > non-DEG expression; less than zero if DEG expression < non-DEG expression). An asterisk (*) is used to denote regions for which DEG expression differs significantly from non-DEG expression (p < 0.05, Wilcoxon rank sum test).
Figure 9
Figure 9
Gene expression shifts in bulk-processed post-mortem spinal cord from ALS patients are consistent with microglia expansion, mature oligodendrocyte attrition and motor neuron loss. ALS-increased DEGs support a model of end-stage disease in which homeostatic (resting) microglia undergo expansion and conversion to an inflammatory phenotype similar to that seen in other neurodegenerative conditions (e.g., MIMS, DAM, CDAM, MGnD). Such phenotypes exhibit increased expression of MHC class II proteins (e.g., HLA-DBP1, HLA-DQB1, HLA-DPA1). This leads to the increased abundance of inflammatory microglia transcripts within the ventral-lateral white matter. ALS-decreased DEGs support a process of oligodendrocyte attrition and loss of mature phenotypes such as MOL5, MOL2 and Int3. This results in decreased synthesis of lipid membrane components and myelin degradation within the white matter. These processes are concurrent with loss of neuron-expressed transcripts within the gray matter, such as kinesin light chain 1 (KLC1), likely reflecting motor neuron death.

Similar articles

References

    1. Brown R.H., Al-Chalabi A. Amyotrophic Lateral Sclerosis. N. Engl. J. Med. 2017;377:162–172. doi: 10.1056/NEJMra1603471. - DOI - PubMed
    1. Wu J.Y., Ye S., Liu X.Y., Xu Y.S., Fan D.S. The burden of upper motor neuron involvement is correlated with the bilateral limb involvement interval in patients with amyotrophic lateral sclerosis: A retrospective observational study. Neural Regen. Res. 2025;20:1505–1512. doi: 10.4103/NRR.NRR-D-23-01359. - DOI - PMC - PubMed
    1. Sun H., Yang B., Li Q., Zhu X., Song E., Liu C., Song Y., Jiang G. Polystyrene nanoparticles trigger aberrant condensation of TDP-43 and amyotrophic lateral sclerosis-like symptoms. Nat. Nanotechnol. 2024;19:1354–1365. doi: 10.1038/s41565-024-01683-5. - DOI - PubMed
    1. Calderón-Garcidueñas L., Stommel E.W., Torres-Jardón R., Hernández-Luna J., Aiello-Mora M., González-Maciel A., Reynoso-Robles R., Pérez-Guillé B., Silva-Pereyra H.G., Tehuacanero-Cuapa S., et al. Alzheimer and Parkinson diseases, frontotemporal lobar degeneration and amyotrophic lateral sclerosis overlapping neuropathology start in the first two decades of life in pollution exposed urbanites and brain ultrafine particulate matter and industrial nanoparticles, including Fe, Ti, Al, V, Ni, Hg, Co, Cu, Zn, Ag, Pt, Ce, La, Pr and W are key players. Metropolitan Mexico City health crisis is in progress. Front. Hum. Neurosci. 2024;17:1297467. doi: 10.3389/fnhum.2023.1297467. - DOI - PMC - PubMed
    1. Khan S., Bano N., Ahamad S., John U., Dar N.J., Bhat S.A. Excitotoxicity, Oxytosis/Ferroptosis, and Neurodegeneration: Emerging Insights into Mitochondrial Mechanisms. Aging Dis. 2025;15:125–144. doi: 10.14336/AD.2024.0125-1. - DOI - PubMed

LinkOut - more resources