. 2025 Jul 7;10(3):257.
doi: 10.3390/jfmk10030257.

Acute Effects of Different Types of Compression Legwear on Biomechanics of Countermovement Jump: A Statistical Parametric Mapping Analysis

Affiliations

Acute Effects of Different Types of Compression Legwear on Biomechanics of Countermovement Jump: A Statistical Parametric Mapping Analysis

Rui-Feng Huang et al. J Funct Morphol Kinesiol. .

Abstract

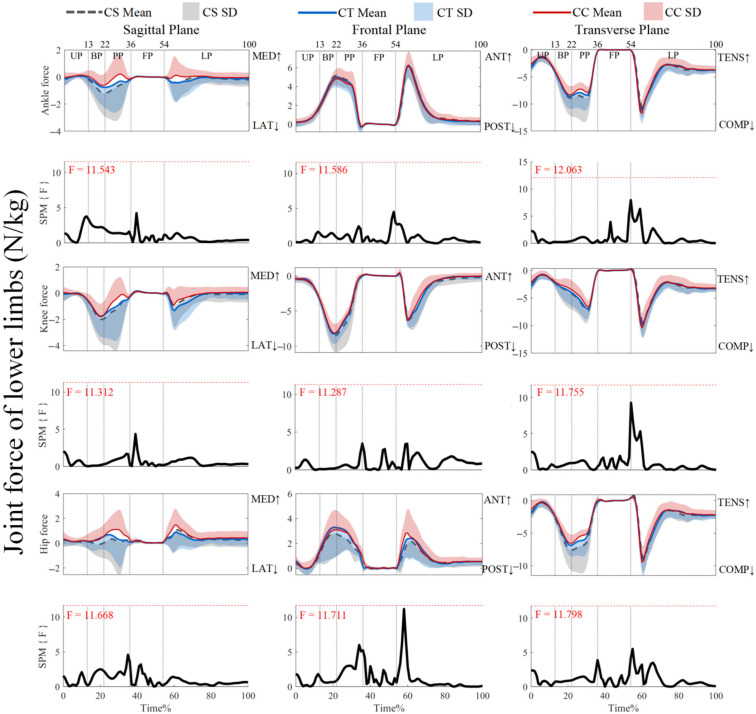
Background: Compression garments (CG) may influence countermovement jump (CMJ) performance by altering hip and knee biomechanics, but existing evidence remains controversial. This study aimed to compare the effects of compression tights (CTs), compression shorts (CSs), and control shorts (CCs) on CMJ performance and lower-limb biomechanics. Methods: Nine physically active men from a university were recruited to perform CMJ while wearing CTs, CSs, and CCs in a randomized sequence for a within-subjects repeated-measures design. A Vicon 3D motion capture system and an AMTI 3D force plate were used to collect biomechanical data. Visual3D software was used to calculate the joint angle, moment, and force of the lower limbs. Results: Statistical parametric mapping analysis with repeated measures analysis of variance (ANOVA) revealed that during the propulsion phase of the CMJ, wearing CSs significantly reduced the hip flexion angle compared to wearing CCs (25-36%); meanwhile, wearing CTs significantly reduced the knee extension and flexion moment (34-35%) and decreased the hip extension moment during the propulsion phase (36-37%). In addition, CTs significantly reduced the hip abduction angle during the flight phase (37-39%), and CSs significantly reduced the hip anterior force during the landing phase (59-60%). Conclusions: Compression legwear significantly affected the hip and knee biomechanics in propulsion, but these differences were not sufficient to improve the CMJ height. Due to the improvement in hip biomechanics in the flight and landing phases, there may be potential benefits for movement transitions and landing performance in CMJ.

Keywords: compression garment; joint kinematics; joint kinetics; jump performance; landing biomechanics.


Conflict of interest statement

The authors declare no conflicts of interest.

Figures

Figure 1
Figure 1
Three types of legwear: (a) CC, (b) CS, and (c) CT.
Figure 2
Figure 2
Mean (SD) patterns for lower-limb joint angles with different types of legwear and time-dependent F-values of SPM. UP, unweighting phase. BP, braking phase. PP, propulsion phase. FP, flight phase. LP, landing phase. DF, dorsiflexion. PF, plantarflexion. ADD, adduction. ABD, abduction. IR, internal rotation. ER, external rotation. FL, flexion. EXT, extension. VAR, varus. VAL, valgus. Red dashed line represents the critical threshold. Arrows represents direction of joint motion. Grey dashed line area represents the supra-threshold cluster region.
Figure 3
Figure 3
Mean (SD) patterns for hip joint angle with different types of legwear and time-dependent t-values of SPM. UP, unweighting phase. BP, braking phase. PP, propulsion phase. FP, flight phase. LP, landing phase. DF, dorsiflexion. PF, plantarflexion. FL, flexion. EXT, extension. ADD, adduction. ABD, abduction. IR, internal rotation. ER, external rotation. Red dashed line represents the critical threshold. Arrows represent direction of joint motion. Grey dashed line area represents the supra-threshold cluster region.
Figure 4
Figure 4
Mean (SD) patterns for lower limb-joint moments with different types of legwear and time-dependent F-values of SPM. UP, unweighting phase. BP, braking phase. PP, propulsion phase. FP, flight phase. LP, landing phase. DF, dorsiflexion. PF, plantarflexion. ADD, adduction. ABD, abduction. IR, internal rotation. ER, external rotation. FL, flexion. EXT, extension. VAR, varus. VAL, valgus. Red dashed line represents the critical threshold. Arrows represent direction of joint motion. Grey dashed line area represents the supra-threshold cluster region.
Figure 5
Figure 5
Mean (SD) patterns for knee joint moment with different types of legwear and time-dependent t-values of SPM. UP, unweighting phase. BP, braking phase. PP, propulsion phase. FP, flight phase. LP, landing phase. FL, flexion. EXT, extension. VAR, varus. VAL, valgus. IR, internal rotation. ER, external rotation. Red dashed line represents the critical threshold. Arrows represent direction of joint motion. Grey dashed line area represents the supra-threshold cluster region.
Figure 6
Figure 6
Mean (SD) patterns for hip joint moment with different types of legwear and time-dependent t-values of SPM. UP, unweighting phase. BP, braking phase. PP, propulsion phase. FP, flight phase. LP, landing phase. FL, flexion. EXT, extension. ADD, adduction. ABD, abduction. IR, internal rotation. ER, external rotation. Red dashed line represents the critical threshold. Arrows represent direction of joint motion. Grey dashed line area represents the supra-threshold cluster region.
Figure 7
Figure 7
Mean (SD) patterns for lower-limb joint forces with different types of legwear and time-dependent F-values of SPM. UP, unweighting phase. BP, braking phase. PP, propulsion phase. FP, flight phase. LP, landing phase. MED, medial. LAT, lateral ANT, anterior. POST, posterior. TENS, tension. COMP, compression. Red dashed line represents the critical threshold. Arrows represent direction of joint motion. Grey dashed line area represents the supra-threshold cluster region.
Figure 8
Figure 8
Mean (SD) patterns for hip joint force with different types of legwear and time-dependent t-values of SPM. UP, unweighting phase. BP, braking phase. PP, propulsion phase. FP, flight phase. LP, landing phase. MED, medial. LAT, lateral ANT, anterior. POST, posterior. TENS, tension. COMP, compression. Red dashed line represents the critical threshold. Arrows represent direction of joint motion. Grey dashed line area represents the supra-threshold cluster region.

References

    1. Carlock J.M., Smith S.L., Hartman M.J., Morris R.T., Ciroslan D.A., Pierce K.C., Newton R.U., Harman E.A., Sands W.A., Stone M.H. The relationship between vertical jump power estimates and weightlifting ability: A field-test approach. J. Strength Cond. Res. 2004;18:534–539. - PubMed
    1. Pehar M., Sekulic D., Sisic N., Spasic M., Uljevic O., Krolo A., Milanovic Z., Sattler T. Evaluation of different jumping tests in defining position-specific and performance-level differences in high level basketball players. Biol. Sport. 2017;34:263–272. doi: 10.5114/biolsport.2017.67122. - DOI - PMC - PubMed
    1. Wagner H., Tilp M., Von Duvillard S., Mueller E. Kinematic analysis of volleyball spike jump. Int. J. Sports Med. 2009;30:760–765. doi: 10.1055/s-0029-1224177. - DOI - PubMed
    1. Rowley K.M., Richards J.G. Increasing plantarflexion angle during landing reduces vertical ground reaction forces, loading rates and the hip’s contribution to support moment within participants. J. Sports Sci. 2015;33:1922–1931. doi: 10.1080/02640414.2015.1018928. - DOI - PubMed
    1. Taylor K., Chapman D., Cronin J., Newton M.J., Gill N. Fatigue monitoring in high performance sport: A survey of current trends. J. Aust. Strength Cond. 2012;20:12–23.

LinkOut - more resources