. 2025 Jul 4;13(3):32.
doi: 10.3390/proteomes13030032.

Proteomic Profiling Reveals Novel Molecular Insights into Dysregulated Proteins in Established Cases of Rheumatoid Arthritis

Affiliations

Proteomic Profiling Reveals Novel Molecular Insights into Dysregulated Proteins in Established Cases of Rheumatoid Arthritis

Afshan Masood et al. Proteomes. .

Abstract

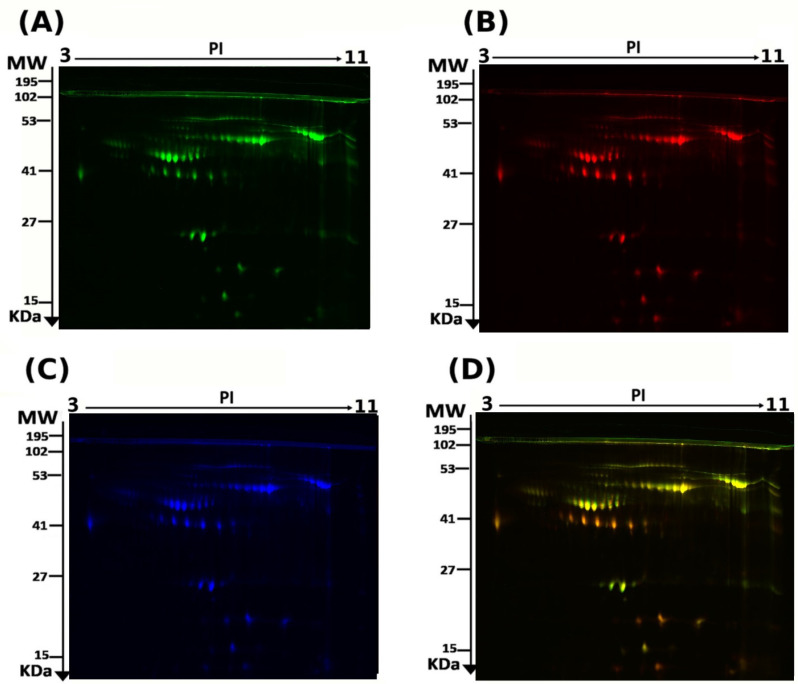
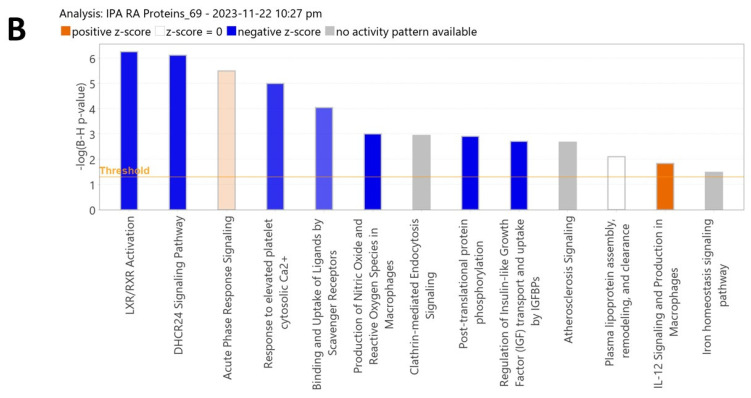
Background: Rheumatoid arthritis (RA) is a chronic autoimmune disorder that predominantly affects synovial joints, leading to inflammation, pain, and progressive joint damage. Despite therapeutic advancements, the molecular basis of established RA remains poorly defined. Methods: In this study, we conducted an untargeted plasma proteomic analysis using two-dimensional differential gel electrophoresis (2D-DIGE) and matrix-assisted laser desorption/ionization time-of-flight mass spectrometry (MALDI-TOF-MS) in samples from RA patients and healthy controls in the discovery phase. Results: Significantly (ANOVA, p ≤ 0.05, fold change > 1.5) differentially abundant proteins (DAPs) were identified. Notably, upregulated proteins included mitochondrial dicarboxylate carrier, hemopexin, and 28S ribosomal protein S18c, while CCDC124, osteocalcin, apolipoproteins A-I and A-IV, and haptoglobin were downregulated. Receiver operating characteristic (ROC) analysis identified CCDC124, osteocalcin, and metallothionein-2 with high diagnostic potential (AUC = 0.98). Proteins with the highest selected frequency were quantitatively verified by multiple reaction monitoring (MRM) analysis in the validation cohort. Bioinformatic analysis using Ingenuity Pathway Analysis (IPA) revealed the underlying molecular pathways and key interaction networks involved STAT1, TNF, and CD40. These central nodes were associated with immune regulation, cell-to-cell signaling, and hematological system development. Conclusions: Our combined proteomic and bioinformatic approaches underscore the involvement of dysregulated immune pathways in RA pathogenesis and highlight potential diagnostic biomarkers. The utility of these markers needs to be evaluated in further studies and in a larger cohort of patients.

Keywords: 2D DIGE; MALDI-TOF; biomarker; metallothionein-2; osteocalcin; plasma proteomics; rheumatoid arthritis.


Conflict of interest statement

The authors declare no conflicts of interest.

Figures

Figure 1
Figure 1
Representative images of two-dimensional difference in gel electrophoresis (2D-DIGE) gels depicting the separation of the fluorescent cye-dye-labeled proteins. RA samples labeled with Cy3 (A), controls labeled with Cy5 (B), pooled internal controls labeled with Cy2 (C), and the merged image (D).
Figure 2
Figure 2
Unsupervised univariate analysis of the DAPs identified between RA and control groups. (A) Principal component analysis of the proteomic dataset demonstrating the separation between the RA and control groups. The green dots indicate the RA patients, and the red dots represent the controls. The PC1 components explained 41.9% of the selected spot’s variability values. The colored dots and numbers represent the gels and spots, respectively. (B) The volcano plot represents the gene names corresponding to the protein spots between the RA and control groups, which revealed significant dysregulation in 89 protein spots based on the cutoffs (cutoff: ANOVA, p-value ≤ 0.05, and FC ≥ 1.5). From these, 28 (red) and 61 (blue) protein spots were upregulated and downregulated, respectively. The gray circled (Non-significant) protein spots (1111) failed to pass both cutoffs and were excluded from further analysis.
Figure 3
Figure 3
Proteomics profiling between the RA and control groups. (A) The orthogonal partial least squares-discriminant analysis (OPLS-DA) score plot showed evident separation between the two groups (RA and controls). The control and RA samples are represented as red and green circles, respectively. (B) The robustness of the created models was evaluated by the fitness of the model (R2Y = 0.987) and predictive ability (Q2 = 0.93) values. (C) The top 10 features of variable importance identified between the RA and control groups. (D) The heat map and hierarchical clustering analysis of the 69 identified proteins that were significantly altered between the RA and control groups based on the Pearson measure and average clustering method with the t-test/ANOVA using MetaboAnalyst Software V6 (Montreal, QC, Canada).
Figure 4
Figure 4
Pie charts showing the protein classes based on (A) molecular function, (B) biological process, and (C) cellular component of the significantly differentially abundant proteins between the RA and control groups.
Figure 5
Figure 5
Multivariate biomarker analysis using the receiver operating characteristic (ROC) curve in patients with rheumatoid arthritis (RA) and control groups, using PLSDA as the feature ranking method. Multiple ROCs were generated using the biomarker analysis module of the MetaboAnalyst software (Montreal, QC, Canada) (www.metaboanalyst.ca). (A) The values of area under the curve (AUC between different models using 3, 5, 10, 20, 35, and 70 of the identified proteins). (B) The top 10 proteins with the highest selected frequency. The individual ROC for (CE) down- and (F) upregulated proteins in RA along with the Box plot (FDR p ≤ 0.05 and fold change ≥ 1.5), where red represents the control, and green represents RA.
Figure 5
Figure 5
Multivariate biomarker analysis using the receiver operating characteristic (ROC) curve in patients with rheumatoid arthritis (RA) and control groups, using PLSDA as the feature ranking method. Multiple ROCs were generated using the biomarker analysis module of the MetaboAnalyst software (Montreal, QC, Canada) (www.metaboanalyst.ca). (A) The values of area under the curve (AUC between different models using 3, 5, 10, 20, 35, and 70 of the identified proteins). (B) The top 10 proteins with the highest selected frequency. The individual ROC for (CE) down- and (F) upregulated proteins in RA along with the Box plot (FDR p ≤ 0.05 and fold change ≥ 1.5), where red represents the control, and green represents RA.
Figure 6
Figure 6
Network and biological pathway analysis relating to the significantly identified proteins in the study. (A) Network pathway analysis of the significantly dysregulated proteins identified in the RA group compared to the control group revealed dysregulation in pathways related to cell-to-cell signaling and interaction, hematological system development and function, and immune cell trafficking. The pathway identified TNF and IFNG as the central nodes. (B) The top canonical pathways related to the DAPs were LXR/RXR activation, DHCR24 signaling pathway, acute-phase response signaling, and response to elevated platelet cytosolic Ca2+ and IL-12 signaling. The blue color indicates an inhibition, while the orange color indicates an activation of these pathways between the RA and control groups.
Figure 6
Figure 6
Network and biological pathway analysis relating to the significantly identified proteins in the study. (A) Network pathway analysis of the significantly dysregulated proteins identified in the RA group compared to the control group revealed dysregulation in pathways related to cell-to-cell signaling and interaction, hematological system development and function, and immune cell trafficking. The pathway identified TNF and IFNG as the central nodes. (B) The top canonical pathways related to the DAPs were LXR/RXR activation, DHCR24 signaling pathway, acute-phase response signaling, and response to elevated platelet cytosolic Ca2+ and IL-12 signaling. The blue color indicates an inhibition, while the orange color indicates an activation of these pathways between the RA and control groups.
Figure 7
Figure 7
Multiple reaction monitoring (MRM) mass spectrometry for validating study findings. The MRM method based on signature peptides was developed to validate the expression of four proteins, namely CCDC124, Apo-A1, OC, and HPT, found in the proteomics approach (2D-DIGE MALDI-TOF-MS). The top panel shows representative MRM chromatograms of selected peptides asterisk (*) indicates the extrapolated concentration value. The bottom panel shows expression of these four proteins preesnted as fold changes between the RA and control groups. Statistical significance was evaluated using an unpaired t-test (n = 120), in which * represents p ≤ 0.05, ** represents p ≤ 0.01 and ns represent non-significant.

Similar articles

References

    1. Almutairi K., Nossent J., Preen D., Keen H., Inderjeeth C. The global prevalence of rheumatoid arthritis: A meta-analysis based on a systematic review. Rheumatol. Int. 2021;41:863–877. doi: 10.1007/s00296-020-04731-0. - DOI - PubMed
    1. Huang Q., Xu W.-D., Su L.-C., Liu X.-Y., Huang A.-F. Association of CD40 Gene Polymorphisms With Systemic Lupus Erythematosus and Rheumatoid Arthritis in a Chinese Han Population. Front. Immunol. 2021;12:642929. doi: 10.3389/fimmu.2021.642929. - DOI - PMC - PubMed
    1. Petrelli F., Mariani F.M., Alunno A., Puxeddu I. Pathogenesis of rheumatoid arthritis: One year in review 2022. Clin. Exp. Rheumatol. 2022;40:475–482. doi: 10.55563/clinexprheumatol/l9lyen. - DOI - PubMed
    1. Schett G., Gravallese E. Bone erosion in rheumatoid arthritis: Mechanisms, diagnosis and treatment. Nat. Rev. Rheumatol. 2012;8:656–664. doi: 10.1038/nrrheum.2012.153. - DOI - PMC - PubMed
    1. Sokolova M.V., Schett G., Steffen U. Autoantibodies in Rheumatoid Arthritis: Historical Background and Novel Findings. Clin. Rev. Allergy Immunol. 2022;63:138–151. doi: 10.1007/s12016-021-08890-1. - DOI - PMC - PubMed

LinkOut - more resources