. 2025 Jun 24;14(3):53.
doi: 10.3390/antib14030053.

Impact of Light-Chain Variants on the Expression of Therapeutic Monoclonal Antibodies in HEK293 and CHO Cells

Affiliations

Impact of Light-Chain Variants on the Expression of Therapeutic Monoclonal Antibodies in HEK293 and CHO Cells

Alexander Veber et al. Antibodies (Basel). .

Abstract

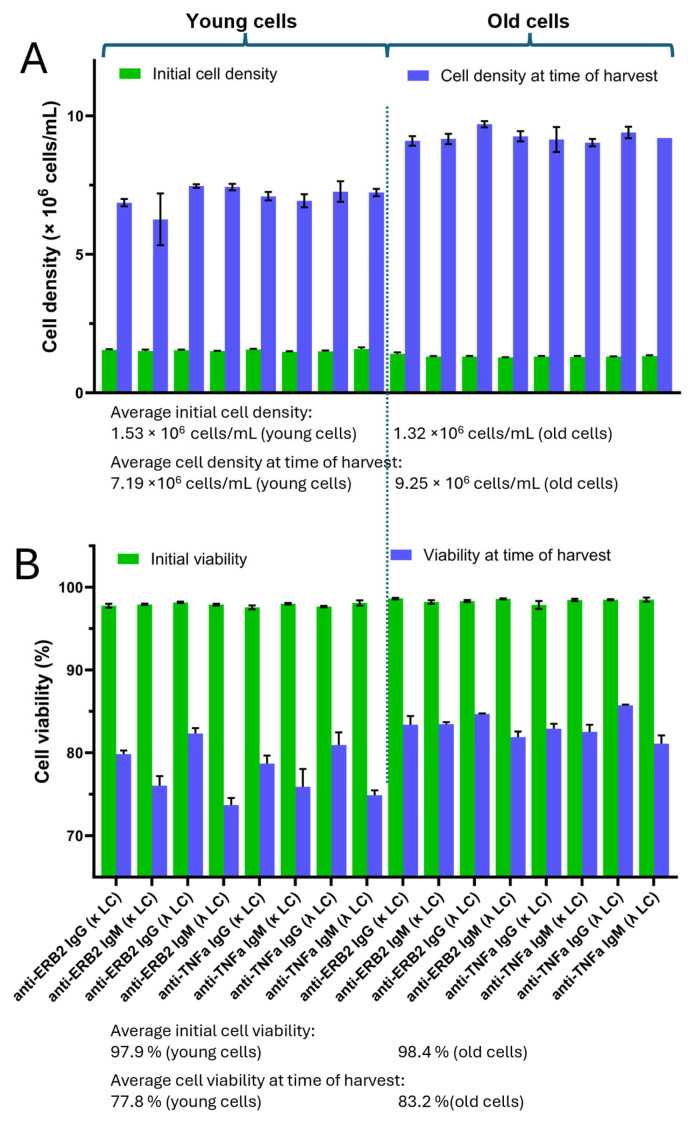
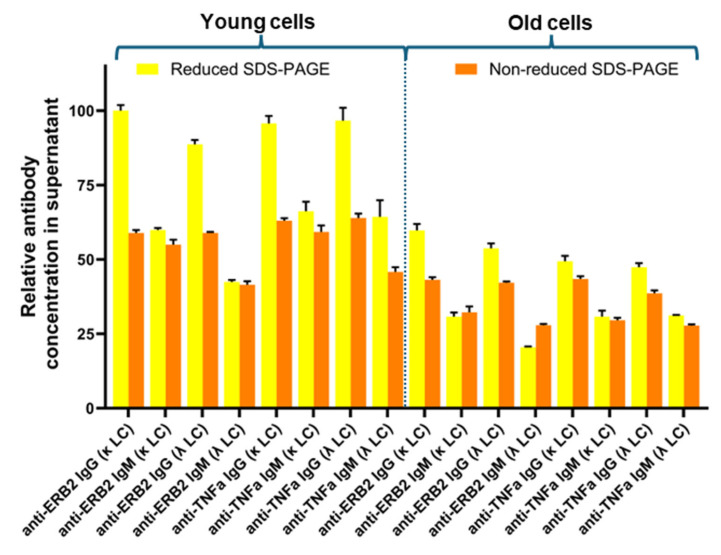
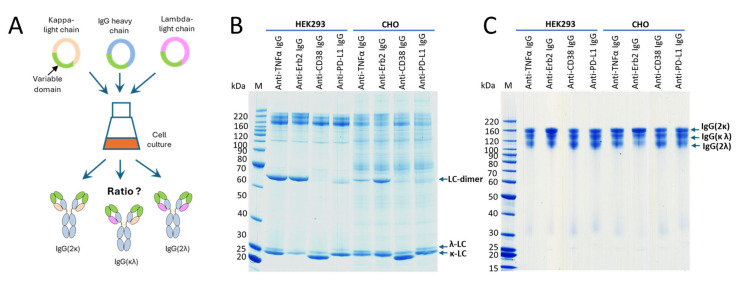
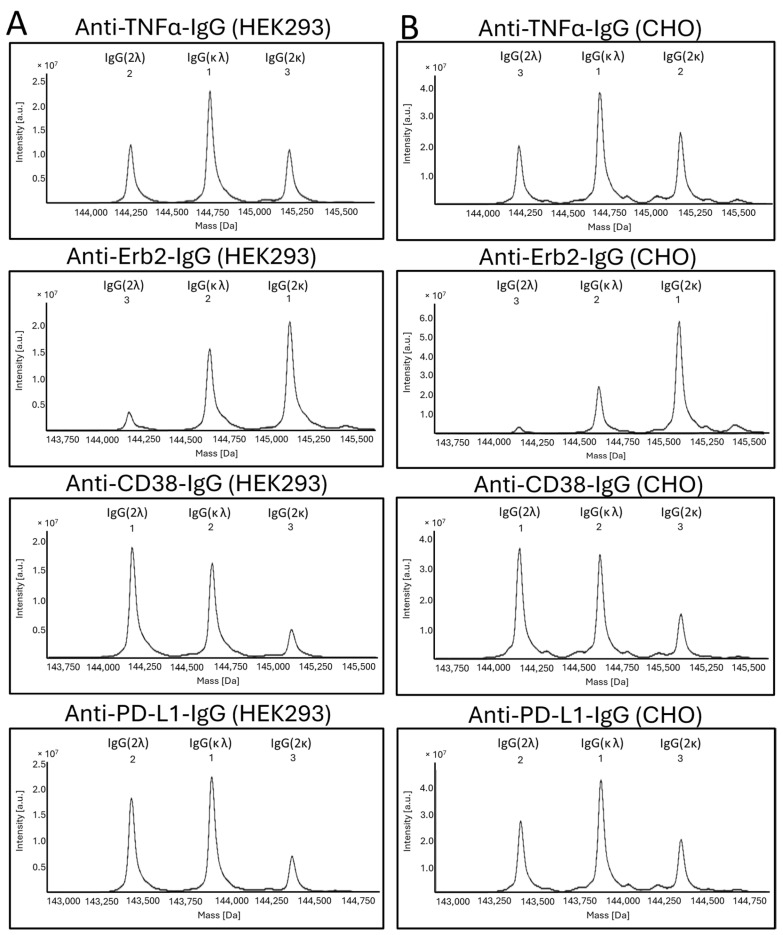
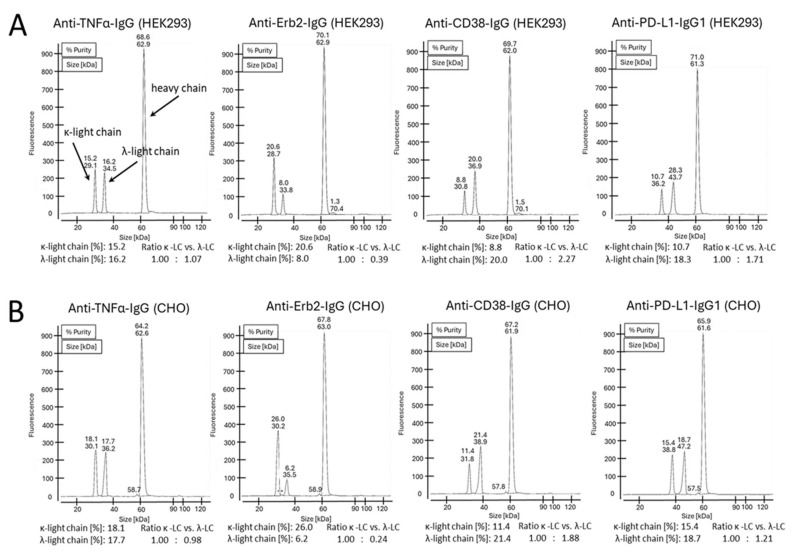
Recombinantly produced monoclonal antibodies (mabs) belong to the fastest growing class of biotherapeutics. In humans, antibodies are classified into five different classes: IgA, IgD, IgE, IgG and IgM. Most of the therapeutic mabs used in the clinic belong to the IgG class, albeit other antibody classes, e.g., IgM, have been evaluated in clinical stages. Antibodies are composed of heavy chains paired with a light chain. In IgM and IgA, an additional chain, the J-chain, is present. Two types of light chains exist in humans: the κ-light chain and the λ-light chain. The κ-light chain predominates in humans and is used in the vast majority of therapeutic IgG. The reason for the preference of the κ-light chain in humans is not known. Our study investigates whether light-chain selection influences the productivity of the clinically validated mabs adalimumab and trastuzumab. Both mabs were expressed as IgG and IgM with a κ- or a λ-light chain in HEK293 cells. Besides comparing the expression levels of the different mabs, we also evaluated whether the passage number of the cell line has an impact on product yield. In addition, the expressions of adalimumab, trastuzumab, an anti-CD38 and an anti-PD-L1-antibody were analyzed in HEK293 and CHO cells when both the κ- and λ-light chains are present. In summary, IgG outperformed IgM variants in expression efficacy, while light-chain selection had minimal impact on the overall expression levels. The yields of all mab variants were higher in fresh cells, despite cell cultures with a high cell passage number having higher cell densities and cell numbers at the time of harvest. The incorporation of a particular light chain occurred at similar rates in HEK293 and CHO cells.

Keywords: CHO cells; HEK cells; Immunoglobulin G (IgG); Immunoglobulin M (IgM); Kappa and Lambda light chain; recombinant expression.


Conflict of interest statement

A.V., D.L., P.G., D.K.B., I.F., W.D.L., C.B., S.W., E.R. and T.L. are employees of Sanofi-Aventis Deutschland GmbH and may hold company shares and/or stock options. A.V. was, during the time of the study, a registered student at Provadis School of International Management and Technology AG, Frankfurt am Main, and working at Sanofi-Aventis Deutschland GmbH. However, the authors declare no additional conflicts of interest.

Figures

Figure 1
Figure 1
Cell densities and cell viabilities of young and old cell cultures. (A) At the time of transfection, all cell cultures had comparable cell densities (green bars). Cells were further incubated for 6 days to allow for protein expression. At the time of harvest, cell densities were measured again (blue bars). (B) At the time of transfection, the cell viability was comparable for all cell cultures (green bar). At the time of harvest, the cell viability of the young cells was more dependent on the expressed antibody type. Cell cultures expressing IgM variants had lower viability compared to cell cultures expressing IgG molecules. Cell viabilities for the old cells were slightly higher without an evident influence of the expressed antibody isoform (blue bars).
Figure 2
Figure 2
Relative antibody concentration in cell culture supernatants at the time of harvest. Protein concentrations were estimated based on the staining intensities of the SDS-PAGE gels at the time of harvest (Figures S1 and S2). In addition to the intact antibodies, excess free light chains were also secreted in the culture supernatant. Thus, the calculated amounts from the reduced SDS-PAGE gels are higher, since the excess free light chains are also considered. The expression level obtained from the reduced SDS-PAGE of anti-Erb2-IgG1(κ) was set as 100%. In general, the expression levels were higher for the young cells compared to the old cells. A clear preference for either the κ- or λ-light chain in combination with IgG or IgM cannot be inferred.
Figure 3
Figure 3
Incorporation of a κ- versus a λ-light chain during co-expression. (A) Schematic representation of the co-expression experiment. For all antibody variants, cells were transiently transfected with plasmids coding for the κ- and λ-light chains as well as the heavy chain in a 1:1:1 ratio. (B) SDS-PAGE from the culture supernatants at the time of harvest. The protein bands corresponding to the different light-chain isotypes as well as the light-chain (LC) dimer are indicated (12% BisTris gel). (C) SDS-PAGE of purified proteins (4–12% BisTris gel). The chosen running conditions allow for the separation of the different antibody species, which are indicated correspondingly. All SDS-PAGE experiments were run under non-reducing conditions using MOPS as the running buffer.
Figure 4
Figure 4
Mass spectrometry spectra of purified antibodies. All measurements were conducted after deglycosylation and under non-reducing conditions. The signals are numerated according to the signal intensities. The antibody species corresponding to each signal are indicated. (A) MS spectra of antibodies produced in HEK293 cells. (B) MS spectra of antibodies produced in CHO cells. The corresponding signal intensities are given in Table 1.
Figure 5
Figure 5
cGE chromatograms of purified antibodies. All measurements were conducted with reduced samples. The signals corresponding to the κ-and λ-light chains as well as heavy chain are indicated. (A) cGE chromatograms of antibodies produced in HEK293 cells. (B) cGE chromatograms of antibodies produced in CHO cells. The calculated area of the κ- and λ-light-chain signals are highlighted. Based on these values, the ratio of total κ- vs. λ-light chain that were incorporated into the IgG molecule was calculated.

Similar articles

References

    1. Strohl W.R., Strohl L.M. Therapeutic Antibody Engineering. Woodhead Publishing; Sawston, UK: 2012. pp. 111–129, 459–595. - DOI
    1. Crescioli S., Kaplon H., Wang L., Visweswaraiah J., Kapoor V., Reichert J.M. Antibodies to watch in 2025. mAbs. 2024;17:2443538. doi: 10.1080/19420862.2024.2443538. - DOI - PubMed
    1. Li Y., Wang G., Li N., Wang Y., Zhu Q., Chu H., Wu W., Tan Y., Yu F., Su X.-D., et al. Structural insights into immunoglobulin M. Science. 2020;367:1014–1017. doi: 10.1126/science.aaz5425. - DOI - PubMed
    1. Giannone C., Mess X., He R., Chelazzi M.R., Mayer A., Bakunts A., Nguyen T., Bushman Y., Orsi A., Gansen B., et al. How J-chain ensures the assembly of immunoglobulin IgM pentamers. EMBO J. 2024;44:505–533. doi: 10.1038/s44318-024-00317-9. - DOI - PMC - PubMed
    1. McBride O., Heiter P., Hollis G., Swan D., Otey M., Leder P. Chromosomal location of human kappa and lambda immunoglobulin light chain constant region genes. J. Exp. Med. 1982;155:1480–1490. doi: 10.1084/jem.155.5.1480. - DOI - PMC - PubMed

LinkOut - more resources