. 2025 Jul 7;8(4):76.
doi: 10.3390/mps8040076.

A Model-Based Approach to Neuronal Electrical Activity and Spatial Organization Through the Neuronal Actin Cytoskeleton

Affiliations

A Model-Based Approach to Neuronal Electrical Activity and Spatial Organization Through the Neuronal Actin Cytoskeleton

Ali H Rafati et al. Methods Protoc. .

Abstract

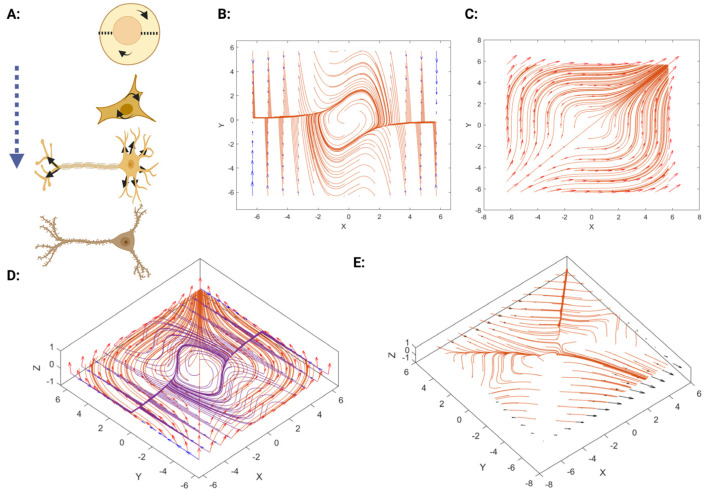
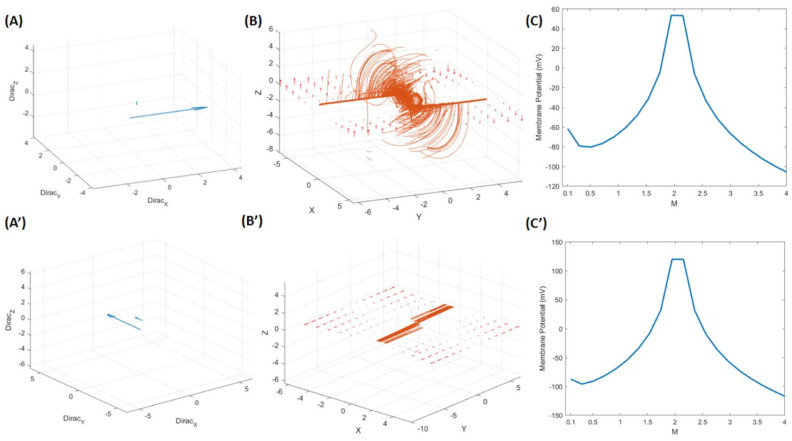
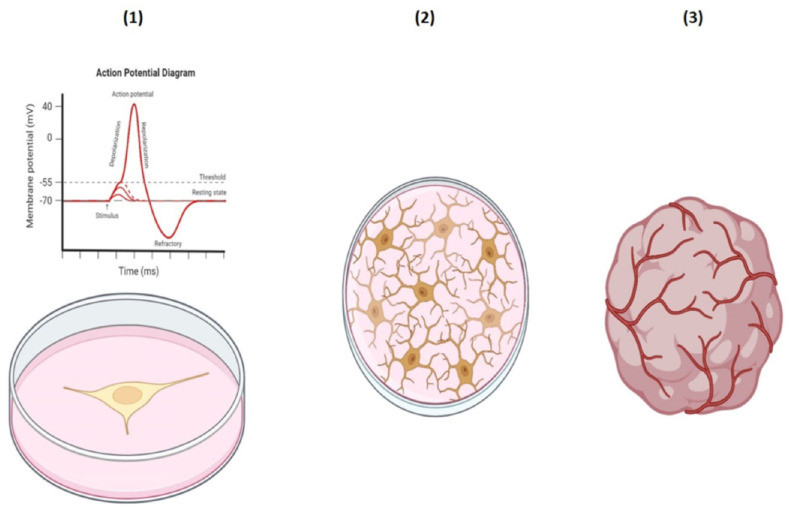
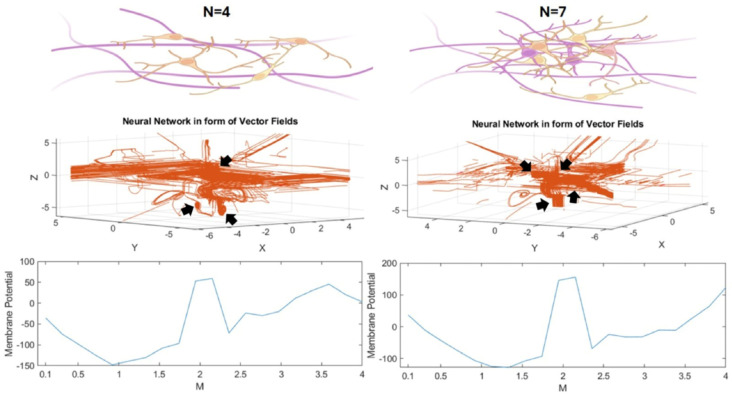
The study of neuronal electrical activity and spatial organization is essential for uncovering the mechanisms that regulate neuronal electrophysiology and function. Mathematical models have been utilized to analyze the structural properties of neuronal networks, predict connectivity patterns, and examine how morphological changes impact neural network function. In this study, we aimed to explore the role of the actin cytoskeleton in neuronal signaling via primary cilia and to elucidate the role of the actin network in conjunction with neuronal electrical activity in shaping spatial neuronal formation and organization, as demonstrated by relevant mathematical models. Our proposed model is based on the polygamma function, a mathematical application of ramification, and a geometrical definition of the actin cytoskeleton via complex numbers, ring polynomials, homogeneous polynomials, characteristic polynomials, gradients, the Dirac delta function, the vector Laplacian, the Goldman equation, and the Lie bracket of vector fields. We were able to reflect the effects of neuronal electrical activity, as modeled by the Van der Pol equation in combination with the actin cytoskeleton, on neuronal morphology in a 2D model. In the next step, we converted the 2D model into a 3D model of neuronal electrical activity, known as a core-shell model, in which our generated membrane potential is compatible with the neuronal membrane potential (in millivolts, mV). The generated neurons can grow and develop like an organoid brain based on the developed mathematical equations. Furthermore, we mathematically introduced the signal transduction of primary cilia in neurons. Additionally, we proposed a geometrical model of the neuronal branching pattern, which we described as ramification, that could serve as an alternative mathematical explanation for the branching pattern emanating from the neuronal soma. In conclusion, we highlighted the relationship between the actin cytoskeleton and the signaling processes of primary cilia. We also developed a 3D model that integrates the geometric organization unique to neurons, which contains soma and branches, such that the mathematical model represents the interaction between the actin cytoskeleton and neuronal electrical activity in generating action potentials. Next, we could generalize the model into a cluster of neurons, similar to an organoid brain model. This mathematical framework offers promising applications in artificial intelligence and advancements in neural networks.

Keywords: actin cytoskeleton; action potential; mathematical modeling; neuronal signaling; organoid brain; primary cilia.


Conflict of interest statement

The authors declare no conflict of interest.

Figures

Figure 1
Figure 1
The schematic illustrations of neuronal primary cilia and the suggested signaling equation. (A) Neuronal primary cilia are indicated by black arrows that receive signals from regional neuronal networks. (B) Schematic illustration showing the signaling in the form of Sonic Hedgehog (Shh) via primary cilia; (C) The (a) and (b) denote two shapes of signaling that differ based on the calculation of complex number in the given incomplete Gamma function, Qx+iy,z and P(x+iy,z) z=5:0., x, y are spatial coordinate. The color coding in panel C of the figure (the 3D plots labeled “a” and “b”) represents the magnitude of the output of the signaling equation involving the incomplete Gamma function. Yellow Peaks: indicate highest magnitude or strongest signal intensity. Green color: represent moderate signal strength. Blue/Purple color: show low or negative signal intensity.
Figure 2
Figure 2
The plots demonstrate the ramifications and branching examples in mathematical terms. A:f1x,y=c  y3x3+xx+1(x2)x+2(x3); B:f2x,y=cy3x2+xx13(x+1)3(x+2)3(x+3)3; C:f3x,y=c+exx13x+13x+23x+33ey3; D:f4x,y=xyc2/3. In this image, the different colors used in each subplot (AD) represent different contour levels for the functions f(x,y). These contours correspond to different constant values of c, and each colored curve is a level curve (or contour line) where the function equals a particular constant value. The color transitions illustrate how the function changes with respect to x and y, helping to visualize the topology and branching behaviour of the function.
Figure 3
Figure 3
The corresponding plots related to Equation (1) are presented here. (A) Schematic illustration of the soma showing the two points on the boundary of the cell, a = (x + iy), b = (x − iy), which grow to the next step with four branches and later develop with the actin rings in the axons and dendrites. Dash lines connect center of the cell soma to the boundry of cell. The actin circles (green circles) are also located in the soma beneath the cell membrane. (B) The red circle denotes the soma defined by the Equation (1d); the Equation (1a–c) corresponds (from left to right) to the generated plots that show how geometrically neuronal branches (blue lines) can grow and develop on the basis of the characteristic polynomials that are represented as primary matrices in Equation (1a–c), respectively.
Figure 4
Figure 4
Schematic illustration of two neurons connecting with their branches containing actin rings, including the details of neuronal and actin cytoskeletal structure. (A) This illustration demonstrates the role of the actin ring in inter-neuronal connectivity through the formation of dendrites and axonal branches. (B1) The points on the line indicate the sequential actin rings along the dendrite, axonal branches, and the sphere generated according to Equation (2). (B2) It schematically shows the neuronal soma with two complex points: (a) z1 = (x + y1i) and (b) z2 = (x − y1i), as well as the schematic actin rings (in green) next to the main circle which is a soma containg two points of a and b on the boundary. (B3) It represents the cross-section of the actin rings, as per (B3), which is a 3D density based on Equations (3) and (4). The color spectrum (dark to bright) reflects the field intesnsity across the actin ring structure.
Figure 5
Figure 5
(A) A schematic illustration of the electrochemical interactions between the cell membrane and nuclear membrane is shown in the form of a vector plot. (A) The alteration in neuronal morphology and geometry is partly due to electrochemical interactions and partly due to the electromechanical effect that leads to branching and ramification in neurons. (B) The Van der Pol oscillator is illustrated in the 2D vector plot. Red-Orange streamlines: Vector field flow direction and intensity from the Van der Pol oscillator. Blue arrows (vertical edges): represent boundary conditions or external perturbations. (C) A form of concentric vector field is shown that represents the circular actin geometry inside the cell soma in 2D. Red-orange streamlines and arrows: A radial or swirling inward/outward vector field, likely illustrating actin dynamics/electrochemical patterns around the nucleus/soma. (D) The superimposed form of the Van der Pol oscillator and concentric vector field to compare with the next plot in. This blend reflects a superimposition of the Van der Pol (in Purple streamlines) and the circular field (in Orange streamlines) and the Red arrows: Represent vector directions. (E), in which their interaction was calculated. (E) The interaction of two vector fields by applying the iterated Lie bracket leads to nerve endings at the periphery of the vector field and branch formation. Orange: Field vectors resulting from the interaction (combined electrochemical + mechanical effects). Black arrows: Shows emergent structures, such as nerve terminals or branch tips. This highlights how interactions cause localized morphogenesis.
Figure 6
Figure 6
The plot represents Equation (11). (A) Vector direction spatially (i, j, k) when we apply it with Dirac(i, j, k)=log(eEFTm). (B) Vector plot related to the gradient of the interaction of two vector fields after applying the iterated Lie bracket in 3D, similar to 2D, shown in Figure 5E. (C) The membrane potential was calculated by applying the electric field as described in Equation (11). The ‘M’ denotes that the van der Pol vector field changes. (A’) shows the Dirac in three axes if we use the vector Laplacian. ‘(B’) represents the vector plot related to the vector Laplacian of the interaction of two vector fields in 3D. ‘(C’) demonstrates the Dirac of the vector Laplacian. (A,A’): Blue direction and magnitude of Dirac vector fields; (B,B’): Orange/Red vector field interaction; flow lines & gradients; (C,C’): Blue (line) is representative of membrane potential plot.
Figure 7
Figure 7
A schematic illustration of a single neuron with recorded electrical activity and action potential (1) left side is representative of Figure 6. However, the schematic illustration of cultured neurons (2) and an organoid brain (3) on the right side shows the equivalent mathematical models demonstrated in Figure 8.
Figure 8
Figure 8
The neural network in the form of a mathematical model with its relevant membrane potential (the blue curve). This design looks like a bunch of neurons in the form of a 3D cell culture (like cultured neurons or an organoid brain, red network); so, N = 4 neurons generated on the left side, and the right side is generated by N = 7 with comparatively stronger action potential tends to become more like an organoid brain. The black arrows indicate visible node-like neurons.

Similar articles

References

    1. Lana D., Ugolini F., Nosi D., Wenk G.L., Giovannini M.G. Alterations in the interplay between neurons, astrocytes and microglia in the rat dentate gyrus in experimental models of neurodegeneration. Front. Aging Neurosci. 2017;9:296. doi: 10.3389/fnagi.2017.00296. - DOI - PMC - PubMed
    1. Hua J.Y., Smith S.J. Neural activity and the dynamics of central nervous system development. Nat. Neurosci. 2004;7:327–332. doi: 10.1038/nn1218. - DOI - PubMed
    1. Yamamoto N., López-Bendito G. Shaping brain connections through spontaneous neural activity. Eur. J. Neurosci. 2012;35:1595–1604. doi: 10.1111/j.1460-9568.2012.08101.x. - DOI - PubMed
    1. Visa N., Percipalle P. Nuclear functions of actin. Cold Spring Harb. Perspect. Biol. 2010;2:a000620. doi: 10.1101/cshperspect.a000620. - DOI - PMC - PubMed
    1. Shim S., Goyal R., Panoutsopoulos A.A., Balashova O.A., Lee D., Borodinsky L.N. Calcium dynamics at the neural cell primary cilium regulate Hedgehog signaling–dependent neurogenesis in the embryonic neural tube. Proc. Natl. Acad. Sci. USA. 2023;120:e2220037120. doi: 10.1073/pnas.2220037120. - DOI - PMC - PubMed

LinkOut - more resources