. 2025 Jul;26(7):e70130.
doi: 10.1111/mpp.70130.

Golgin Protein MoCoy1 Mediates Retrograde Trafficking From the Golgi to the ER, Regulating Fungal Development and Pathogenicity in Magnaporthe oryzae

Affiliations

Golgin Protein MoCoy1 Mediates Retrograde Trafficking From the Golgi to the ER, Regulating Fungal Development and Pathogenicity in Magnaporthe oryzae

Xiaoru Kang et al. Mol Plant Pathol. 2025 Jul.

Abstract

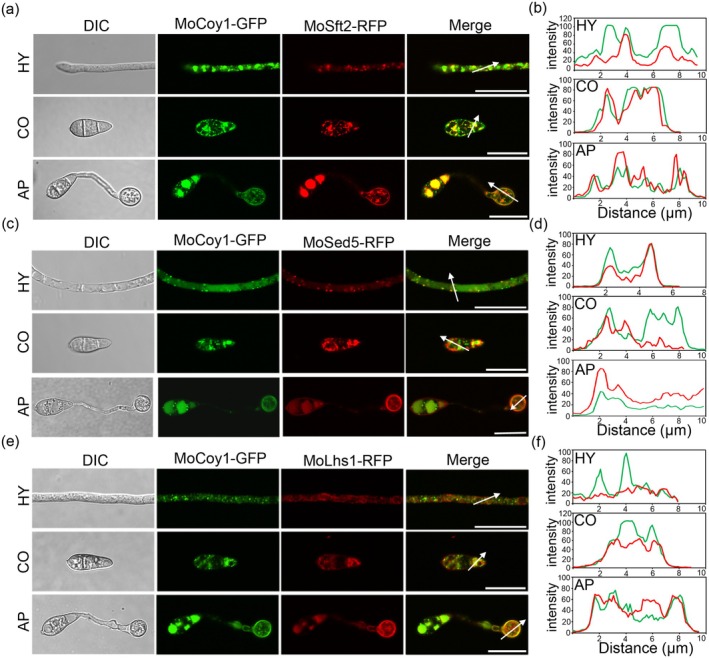
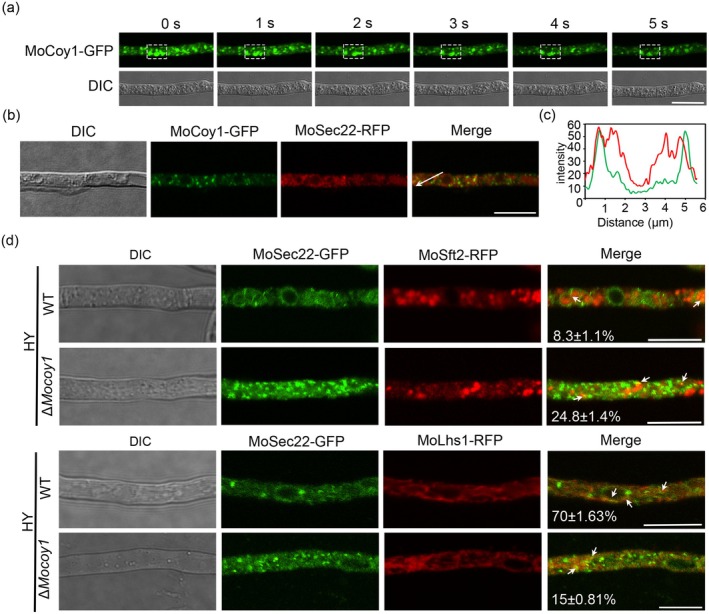
The Golgi apparatus is a vital organelle involved in protein sorting and trafficking. Golgins, a family of coiled-coil proteins, play an important role in maintaining the structure and function of the Golgi apparatus in eukaryotes. However, the function of golgins in the plant-pathogenic fungus Magnaporthe oryzae remains uncharacterised. Here, we systematically investigated the biological role of the golgin protein MoCoy1 in M. oryzae. Our results show that MoCoy1 is primarily localised to the Golgi apparatus. MoCOY1 deletion led to defects in vegetative growth, conidiation and pathogenicity of M. oryzae. In addition, MoCoy1 affected the secretion of the cytoplasmic effector proteins. Furthermore, MoCoy1 interacted with retrograde Golgi-related components and affected the retrograde transport from the Golgi to the endoplasmic reticulum (ER). Overall, our findings suggest that the golgin protein MoCoy1 mediates ER-Golgi retrograde trafficking, thereby regulating the development and pathogenicity of M. oryzae.

Keywords: Magnaporthe oryzae; Golgins; MoCoy1; pathogenicity; retrograde trafficking.


Conflict of interest statement

The authors declare no conflicts of interest.

Figures

FIGURE 1
FIGURE 1
Subcellular localisation of MoCoy1 in Magnaporthe oryzae. (a) Fluorescence signals from the wild‐type (WT) strain Guy11 expressing MoCoy1‐GFP and the trans‐Golgi marker MoSft2‐RFP were observed in hyphae (HY), conidia (CO) and appressoria (AP) at 6 h using a confocal microscope (Nikon). Scale bar, 20 μm. (b) The fluorescence intensities of MoCoy1‐GFP and MoSft2‐RFP were quantified using ImageJ software in HY, CO and AP. A line‐scan graph analysis of the region indicated by the arrow. (c) The fluorescence signals of the WT strain Guy11 expressing MoCoy1‐GFP and the cis‐Golgi marker MoSed5‐RFP were observed in HY, CO and AP at 6 h using a confocal microscope (Nikon). Scale bar, 20 μm. (d) The fluorescence intensity of MoCoy1‐GFP and MoSed5‐RFP in HY, CO and AP were quantified using ImageJ software. A line‐scan graph analysis of the region indicated by the arrow. (e) The fluorescence signals of the WT strain Guy11 expressing MoCoy1‐GFP and the endoplasmic reticulum (ER) marker MoLhs1‐RFP were observed in HY, CO and AP at 6 h using a confocal microscope (Nikon). Scale bar, 20 μm. (f) The fluorescence intensity of MoCoy1‐GFP and MoLhs1‐RFP in HY, CO and AP were quantified using ImageJ software. A line‐scan graph analysis of the region indicated by the arrow.
FIGURE 2
FIGURE 2
MoCoy1 is involved in the vegetative growth, conidiation and pathogenicity of Magnaporthe oryzae. (a) The wild‐type (WT) strain Guy11, the ΔMocoy1 mutant and the complemented strain ΔMocoy1/MoCOY1 were cultured on complete medium (CM) at 28°C in the dark and photographed after 7 days. (b) Colony diameters of the indicated strains were measured after 7 days of grown on CM. (c) Conidiophores of the indicated strains were observed. Scale bar, 20 μm. (d) Conidiation of the indicated strains grown on rice decoction corn (RDC) medium. (e) Conidia of the indicated strains were stained with Calcofluor White (CFW), and their conidia were observed. Scale bar, 20 μm. (f) Percentages of conidia containing one, two and three cells in the indicated strains. Data represent the three independent biological replications with 100 conidia (n = 100) each time. Statistical analysis was performed using Microsoft Office Excel and a two‐sample Student's t test. Error bars represent ±SD. (g) Pathogenicity assay on isolated barley leaves inoculated with mycelial plugs of the indicated strains for 5 days post‐inoculation (dpi). Scale bar, 10 mm. (h) Lesion areas were calculated using ImageJ software. (i) Pathogenicity test on rice seedlings inoculated with conidia suspensions of the indicated strains at 5 dpi. Scale bar, 10 mm. (j) Lesion numbers were counted within 5‐cm leaf segments. All data for statistical analysis were obtained from three independent biological replicates, each with at least three (n = 3) technical replicates. Statistical analysis was performed using Microsoft Office Excel and a two‐sample Student's t test. Error bars represent ±SD. Asterisks indicate significant differences between the WT strain Guy11 and the ΔMocoy1 mutant (**p < 0.01).
FIGURE 3
FIGURE 3
MoCoy1 is essential for appressorium formation, invasive hyphal growth and host‐derived reactive oxygen species (ROS) scavenging in Magnaporthe oryzae. (a) Appressorium formation assays were conducted for the indicated strains on the hydrophobic surfaces at 4, 6, 8, 12 and 24 h. Scale bar, 20 μm. (b) Appressorium formation rates (%) of the indicated strains. Each experiment included three independent biological replicates with 100 conidia (n = 100) each time. Statistical analysis was performed using Microsoft Office Excel and a two‐sample Student's t test. Error bars represent ±SD. Asterisks indicate significant differences between the wild‐type (WT) strain Guy11 and the ΔMocoy1 mutant (**p < 0.01). (c) Types of invasive hyphae (IH) in rice leaf sheath cells: T1, penetration peg only; T2, a single invasive hyphal without branch; T3, branched hypha restricted to a single cell; T4, hypha extending into neighbouring cells. Scale bar, 20 μm. (d) Statistical analysis of invasive hyphal types was conducted at 36 h post‐inoculation (hpi). The experiment was performed across three independent biological replicates and 100 penetration sites (n = 100) each time. Statistical analysis was performed using Microsoft Office Excel and a two‐sample Student's t test. Error bars represent ±SD. (e) Rice leaf sheaths infected with conidial suspensions of the indicated strains were stained with 3,3'‐diaminobenzidine (DAB) solution. Scale bar, 20 μm. (f) The proportion of infected cells showing DAB staining. The experiment was performed across three independent biological replicates, with 100 infected cells evaluated per strain each time (n = 100). (g) IH in rice leaf sheaths infected with conidial suspensions treated with diphenylene iodonium (DPI) of the indicated strains was observed at 30 hpi. Conidial suspensions treated with dimethyl sulphoxide (DMSO) served as the control. Scale bar, 50 μm. (h) Relative expression levels of reactove oxygen species (ROS) detoxification‐related genes were assessed in the WT strain Guy11 and the ΔMocoy1 mutant. The β‐tubulin gene (MGG_00604) was used as the reference gene. The experiment was performed across three independent biological replicates and four technical replicates (n = 4) each time for each sample. Statistical analysis was performed using Microsoft Office Excel and a two‐sample Student's t test. Error bars represent ±SD. Asterisks indicate significant difference between the WT strain Guy11 and the ΔMocoy1 mutant (**p < 0.01).
FIGURE 4
FIGURE 4
MoCoy1 is involved in the stress response in Magnaporthe oryzae. (a) The wild‐type (WT) strain Guy11, the ΔMocoy1 mutant and the complemented strain ΔMocoy1/MoCOY1 were cultured on complete medium (CM) supplemented with 0.2 mg/mL Calcofluor White (CFW), 0.6 mg/mL Congo Red (CR) or 0.01% sodium dodecyl sulphate (SDS) at 28°C in the dark. Cultures were observed and imaged after 7 days. (b) Colony diameters of the indicated strains were measured after 7 days, and relative inhibition rates were calculated. (c) The WT strain Guy11, the ΔMocoy1 mutant and the complemented strain ΔMocoy1/MoCOY1 were also cultured on CM supplemented with 0.7 M NaCl, 0.6 M KCl or 1 M sorbitol under the same conditions, and colonies were observed and photographed after 7 days. (d) Colony diameters were measured and relative inhibition rates were calculated. (e) The protoplast of the indicated strains. Mycelia were treated with cell wall‐degrading enzymes at 30°C for 60 min. Scale bar, 20 μm. (f) The number of protoplasts from each strain was counted at 30, 60 and 90 min. (g) The WT strain Guy11, the ΔMocoy1 mutant and the complemented strain ΔMocoy1/MoCOY1 were cultured on CM supplemented with 2.5 mM, 5 mM or 10 mM H2O2 at 28°C in the dark, and colonies were imaged after 7 days. (h) Colony diameters were measured after 7 days and relative inhibition rates were calculated. All experiments were performed with three independent biological replicates, each with three technical replicates (n = 3) each time for each sample. Statistical analysis was performed using Microsoft Office Excel and a two‐sample Student's t test. Error bars represent ±SD. Asterisks indicate significant difference between the WT strain Guy11 and the ΔMocoy1 mutant (no significant difference [NS] p > 0.05, *p < 0.05, **p < 0.01).
FIGURE 5
FIGURE 5
The cut alternatively spliced product (CASP) domain is essential for the localisation and biological function of MoCoy1 in Magnaporthe oryzae. (a) Schematic representation of CASP domains in MoCoy1. (b) Distribution of MoCoy1‐GFP and MoCoy1ΔCASP‐RFP in hyphae (HY), conidia (CO) and appressoria (AP) at 6 h post‐inoculation (hpi). Scale bar, 20 μm. (c) The wild‐type (WT) strain Guy11, the ΔMocoy1 mutant, the MoCoy1ΔCASP mutant and the complemented strain ΔMocoy1/MoCOY1 were cultured on complete medium (CM) at 28°C for 7 days. (d) Colony diameters of the indicated strains were measured after 7 days. The experiment was performed with three independent biological replicates, each with three technical replicates (n = 3) each time for each sample. Statistical analyses were performed using Microsoft Office Excel and a two‐sample Student's t test. Error bars represent ±SD). Asterisks indicate significant differences between the WT strain Guy11 and the ΔMocoy1 mutant or the MoCoy1ΔCASP mutant (**p < 0.01). (e) Conidiophores of the indicated strains were observed under a light microscope. Scale bar, 20 μm. (f) Conidiation of the indicated strains was assessed on rice decoction corn (RDC) medium. Data represent three independent biological replicates, each with three technical replicates (n = 3) each time for each strain. Statistical analysis was performed using Microsoft Office Excel and a two‐sample Student's t test. Error bars represent ±SD. (g) Pathogenicity assays were performed on isolated barley leaves inoculated with mycelial plugs of the indicated strains for 5 days post‐inoculation (dpi). Scale bar, 10 mm. (h) Pathogenicity was also evaluated on rice seedlings inoculated with conidial suspensions of the indicated strains for 5 dpi. Scale bar, 10 mm. (i) Lesion numbers were quantified within 4 cm segments of inoculated leaves. Data were derived from three independent biological replicates, each with three technical replicates (n = 3) each time for each strain. Statistical analysis was performed using Microsoft Office Excel and a two‐sample Student's t test (**p < 0.01).
FIGURE 6
FIGURE 6
MoCoy1 is involved in the secretion of the cytoplasmic effector AvrPia. (a) The subcellular localisation of the apoplastic effector MoSlp1‐GFP. Barley epidermis cells infected with conidial suspensions of the wild‐type (WT) strain Guy11 and the ΔMocoy1 mutant expressed MoSlp1‐GFP for 30 h. Scale bar, 20 μm. (b) A statistical analysis of the distribution pattern of MoSlp1‐GFP in the WT strain Guy11 and the ΔMocoy1 mutant. The experiment was performed using three independent biological replicates, each including 50 invasive hyphae (IH) (n = 3) each time for each sample. Statistical analysis was performed using Microsoft Office Excel and a two‐sample Student's t test. Error bars represent ±SD. Asterisks indicate significant differences between the WT strain Guy11 and ΔMocoy1 mutant (no significant difference [NS] p > 0.05, *p < 0.05, **p < 0.01). (c) MoSlp1‐GFP expression detection in hyphae (HY) and IH by western blotting. CBS indicates Coomassie brilliant blue staining. (d) Subcellular localisation of the cytoplasmic effector AvrPia‐GFP. Barley epidermal cells infected with conidial suspensions of the WT strain Guy11 and the ΔMocoy1 mutant expressing AvrPia‐GFP for 30 h. White arrows indicate biotrophic interfacial complexes (BICs). Scale bar, 20 μm. (e) A statistical analysis of the distribution pattern of AvrPia‐GFP in WT strain Guy11 and the ΔMocoy1 mutant. The experiment was performed using three independent biological replicates with 50 IH (n = 3) each time for each sample. Statistical analysis was performed using Microsoft Office Excel and a two‐sample Student's t test. Error bars represent ±SD. Asterisks indicate significant differences between the WT strain Guy11 and ΔMocoy1 mutant (NS, p > 0.05; *p < 0.05; **p < 0.01). (f) AvrPia‐GFP expression in HY and IH was detected by western blotting. CBS indicates Coomassie brilliant blue staining.
FIGURE 7
FIGURE 7
MoCoy1 influences the trafficking of MoSec22‐GFP. (a) Time‐lapse imaging of hyphae (HY) expressing MoCoy1‐GFP in the wild‐type (WT) strain Guy11 was performed at various time intervals. Scale bar, 10 μm. The white dashed box highlights the dynamic MoCoy1. (b) Fluorescence signals from HY expressing MoCoy1‐GFP and MoSec22‐RFP in the WT strain Guy11 were observed using confocal microscopy. Scale bar, 10 μm. (c) Fluorescence intensities of MoCoy1‐GFP and MoSec22‐RFP in HY were quantified using ImageJ software. A line‐scan graph analysis of the region indicated by the arrow. (d) Localisation of MoSec22‐GFP with MoSft2‐RFP and MoLhs1‐RFP was examined in the HY of both the WT strain Guy11 and the ΔMocoy1 mutant. Scale bar, 10 μm. Arrowheads indicate the co‐localisation between MoSec22‐GFP and either MoSft2‐RFP or MoLhs1‐RFP. The percentage of the co‐localisation between GFP and RFP signals was quantified.
FIGURE 8
FIGURE 8
MoCoy1‐interacting proteins are implicated in vegetative growth, conidiation and pathogenicity in Magnaporthe oryzae. (a) Co‐immunoprecipitation (Co‐IP) assays were performed to assess interactions between MoCoy1 and MoSed5, MoSly1, MoGos1 and MoCog3. (b) Mycelial plugs of the indicated strains were cultured on complete medium (CM) at 28°C in the dark and observed and imaged after 7 days. (c) Colony diameters of the strains grown on CM for 7 days were measured. (d) Conidiation of the indicated strains grown on rice decoction corn (RDC) medium. (e) Conidiophores of the indicated strains were observed. Scale bar, 20 μm. (f) A pathogenicity assay was conducted on isolated barley leaves inoculated with mycelial plugs from the indicated strains for 5 days post‐inoculation (dpi). Scale bar, 10 mm. (g) Lesion areas were quantified using ImageJ software. (h) Pathogenicity tests were also performed on rice seedlings inoculated with conidial suspensions of the indicated strains and observed at 5 dpi. Scale bar, 10 mm. (i) Lesion numbers were counted over a 4 cm segment of the leaf.

Similar articles

References

    1. Agliarulo, I. , and Parashuraman S.. 2022. “Golgi Apparatus Regulates Plasma Membrane Composition and Function.” Cells 11: 368. - PMC - PubMed
    1. Anderson, N. S. , and Barlowe C.. 2019. “Conserved Juxtamembrane Domains in the Yeast Golgin Coy1 Drive Assembly of a Megadalton‐Sized Complex and Mediate Binding to Tethering and SNARE Proteins.” Journal of Biological Chemistry 294: 9690–9705. - PMC - PubMed
    1. Anderson, N. S. , Mukherjee I., Bentivoglio C. M., and Barlowe C.. 2017. “The Golgin Protein Coy1 Functions in Intra‐Golgi Retrograde Transport and Interacts With the COG Complex and Golgi SNAREs.” Molecular Biology of the Cell 28: 2686–2700. - PMC - PubMed
    1. Banfield, D. K. 2011. “Mechanisms of Protein Retention in the Golgi.” Cold Spring Harbor Perspectives in Biology 3: a005264. - PMC - PubMed
    1. Barlowe, C. K. , and Miller E. A.. 2013. “Secretory Protein Biogenesis and Traffic in the Early Secretory Pathway.” Genetics 193: 383–410. - PMC - PubMed

MeSH terms

Supplementary concepts

LinkOut - more resources