

An autoencoder learning method for predicting breast cancer subtypes
- PMID: 40700427
- PMCID: PMC12286384
- DOI: 10.1371/journal.pone.0327773
An autoencoder learning method for predicting breast cancer subtypes
Abstract
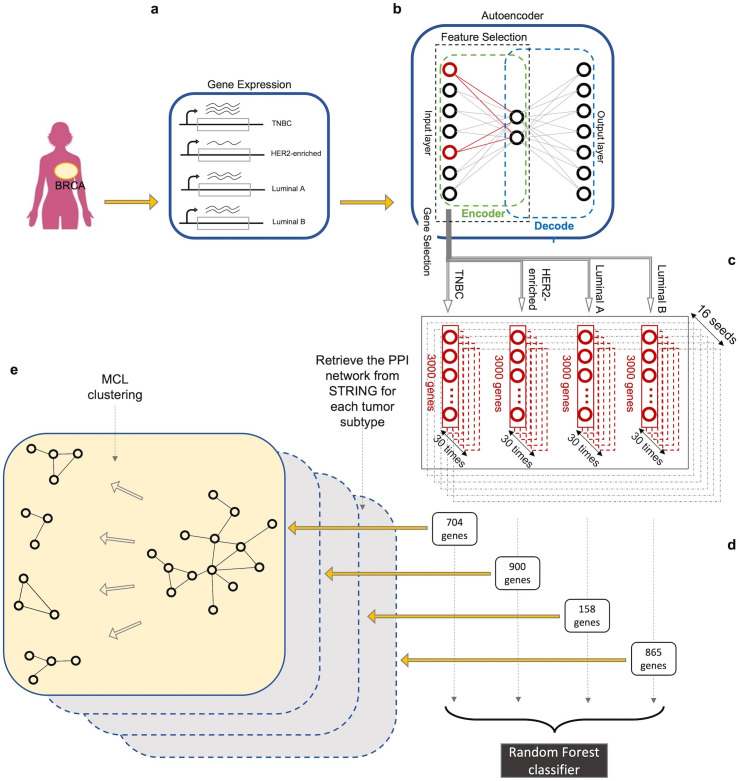
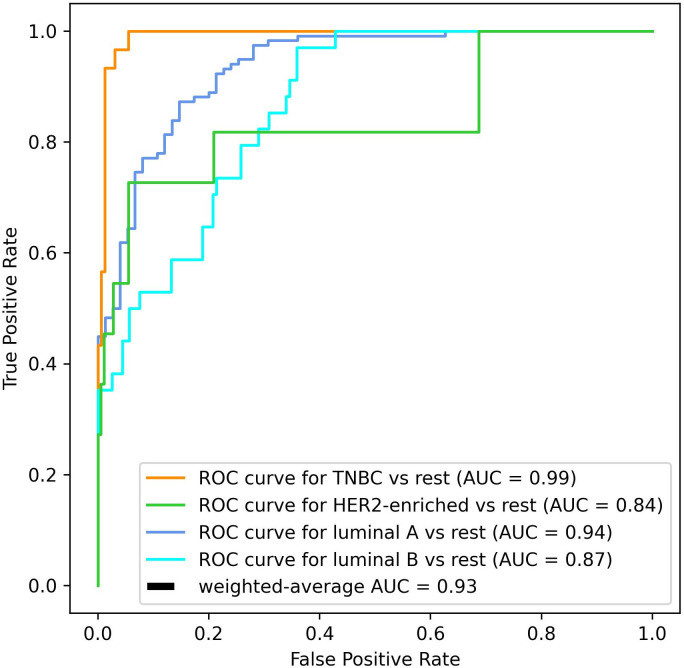
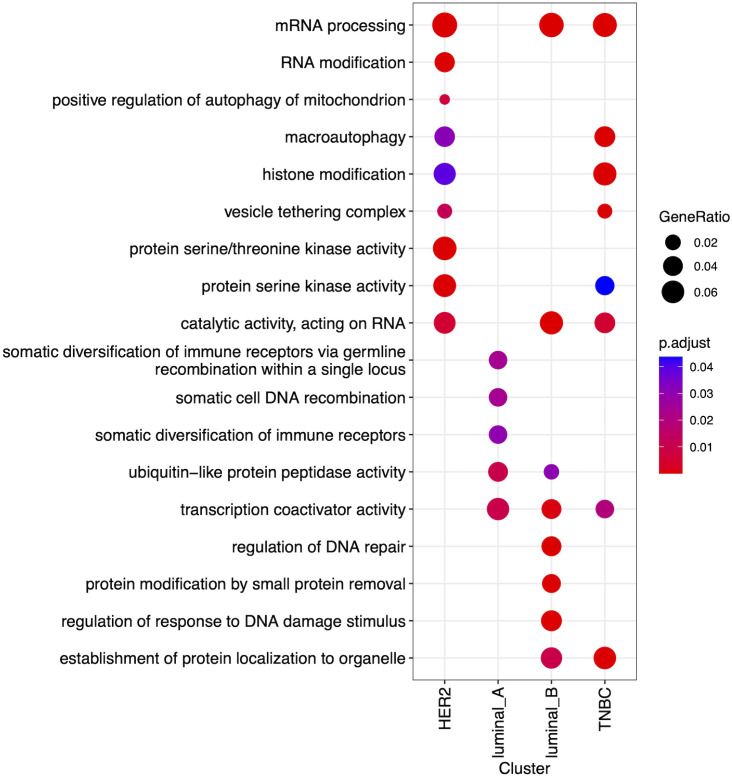
Heterogeneity of breast cancer poses several challenges for detection and treatment. With next-generation sequencing, we can now map the transcriptional profile of each patient's breast tissue, which has the potential for identifying and characterizing cancer subtypes. However, the large dimensionality of this transcriptomic data and the heterogeneity between the molecular profiles of breast cancers poses a barrier to identifying minimal markers and mechanistic consequences. In this study, we develop an autoencoder to identify a reduced set of gene markers that characterize the four major breast cancer subtypes with the accuracy of 82.38%. The reduced feature space created by our model captures the functional characteristics of each breast cancer subtype highlighting mechanisms that are unique to each subtype as well as those that are shared. Our high prediction accuracy shows that our markers can be valuable for breast cancer subtype detection and have the potential to provide insights into mechanisms associated with each subtype.
Copyright: © 2025 Rostami et al. This is an open access article distributed under the terms of the Creative Commons Attribution License, which permits unrestricted use, distribution, and reproduction in any medium, provided the original author and source are credited.
Conflict of interest statement
The authors have declared that no competing interests exist.
Figures
Similar articles
-
New insights for precision treatment of glioblastoma from analysis of single-cell lncRNA expression.J Cancer Res Clin Oncol. 2021 Jul;147(7):1881-1895. doi: 10.1007/s00432-021-03584-9. Epub 2021 Mar 11. J Cancer Res Clin Oncol. 2021. PMID: 33693962 Free PMC article.
-
Molecular feature-based classification of retroperitoneal liposarcoma: a prospective cohort study.Elife. 2025 May 23;14:RP100887. doi: 10.7554/eLife.100887. Elife. 2025. PMID: 40407808 Free PMC article.
-
Can a Liquid Biopsy Detect Circulating Tumor DNA With Low-passage Whole-genome Sequencing in Patients With a Sarcoma? A Pilot Evaluation.Clin Orthop Relat Res. 2025 Jan 1;483(1):39-48. doi: 10.1097/CORR.0000000000003161. Epub 2024 Jun 21. Clin Orthop Relat Res. 2025. PMID: 38905450
-
Cost-effectiveness of using prognostic information to select women with breast cancer for adjuvant systemic therapy.Health Technol Assess. 2006 Sep;10(34):iii-iv, ix-xi, 1-204. doi: 10.3310/hta10340. Health Technol Assess. 2006. PMID: 16959170
-
The Black Book of Psychotropic Dosing and Monitoring.Psychopharmacol Bull. 2024 Jul 8;54(3):8-59. Psychopharmacol Bull. 2024. PMID: 38993656 Free PMC article. Review.
References
-
- Dhiman P, Bonkra A, Kaur A, Gulzar Y, Hamid Y, Mir MS, et al. Healthcare Trust Evolution with Explainable Artificial Intelligence: Bibliometric Analysis. Information. 2023;14(10):541. doi: 10.3390/info14100541 - DOI
MeSH terms
Substances
LinkOut - more resources
Full Text Sources
Medical
