. 2025 Jul 23;23(7):e3003261.
doi: 10.1371/journal.pbio.3003261. eCollection 2025 Jul.

Legionella effector LpPIP recruits protein phosphatase 1 to the mitochondria to induce dephosphorylation of outer membrane proteins

Affiliations

Legionella effector LpPIP recruits protein phosphatase 1 to the mitochondria to induce dephosphorylation of outer membrane proteins

Kai-Qi Yek et al. PLoS Biol. .

Abstract

Legionella pneumophila utilizes a type IVB secretion system (T4SS) to translocate over 300 effector proteins into host cells, hijacking cellular processes, including those within the mitochondrion. Currently, no Legionella effectors have been identified at the mitochondrial outer membrane, a critical interface between the organelle and the rest of the cell. We screened the Legionella effector repertoire for features of mitochondrial tail-anchored (TA) proteins and identified four putative TA effectors. Among them, LpPIP (Lpg1625) localizes to the mitochondrial outer membrane and interacts with all three isoforms of protein phosphatase 1 (PP1) via an RVxF motif, functioning as a PP1-interacting protein (PIP). Importantly, PP1 remains catalytically active upon interaction with LpPIP to dephosphorylate mitochondrial outer membrane proteins. Altering the TA signature to direct LpPIP to the ER induces ER-recruitment of PP1 and dephosphorylation of ER-resident proteins, indicating that LpPIP controls PP1 localization and not substrate specificity. This study uncovers a novel pathogen-mediated strategy to modulate PP1 and manipulate the host cell phosphoproteome.


Conflict of interest statement

The authors have declared that no competing interests exist.

Figures

Fig 1
Fig 1. L. pneumophila targets mitochondria using T4SS effectors with tail anchors (TA).
(A) Schematic representation of the bioinformatics workflow used to screen for L. pneumophila T4SS effectors (see S1 Text) that contain a TA with net positive tail charges (see S1 Table). (B) Features of the four effectors predicted to contain a TA with a net positive charge in their C-tail. TMHMM and TOPCONS were used to predict the number and location of transmembrane domains (TMDs) present within the 302 effectors screened. A black dot indicates the prediction of one TMD, while a white dot indicates no predicted TMD. The length of the predicted TMD and C-tail, along with the net C-tail charge, is indicated. (C) Representative images of HeLa cells transiently transfected with FLAGLpg1625, FLAGLpg1803, FLAGLpg2344, or FLAGLpg2444. Transfected cells were fixed and processed for immunofluorescence with antibodies against FLAG (green) and NDUFAF2 (mitochondria; magenta). Nuclei were stained with Hoechst 33258 (blue). Scale bar represents 10 μm. (D) Mitochondrial sub-fractionation and carbonate extraction using mitochondria isolated from HeLa cells transiently transfected with FLAGLpg1625. Mitochondria were either left intact (lanes 1 and 2), subjected to hypotonic swelling (lanes 3 and 4), or solubilized with 0.5% Triton X-100 (lanes 5 and 6). Samples treated with Proteinase K (PK) are indicated (+). Mitochondria were also subjected to sodium carbonate extraction, with pellet (P) and supernatant (S) fractions (lanes 7 and 8) separated via ultracentrifugation. Samples were analyzed using SDS-PAGE and immunoblotting using the indicated antibodies. Corresponding raw images are available in the Supporting information (S1 Raw Images). (E) HeLa cells transiently transfected with FLAGLpg1625, FLAGLpg16251-108, FLAGLpg162585-130, FLAGLpg1625K128A, and FLAGLpg1625AAA (K97A/R100A/K128A) were processed for immunofluorescence with antibodies against FLAG (green) and NDUFAF2 (mitochondria; magenta). Nuclei were stained with Hoechst 33258 (blue). Scale bar represents 10 μm.
Fig 2
Fig 2. Lpg1625 recruits PP1 to mitochondria via an RVxF motif.
(A) Mitochondria were isolated from wild-type HeLa cells or cells transiently transfected with FLAGLpg1625 and solubilized in 1% digitonin prior to immunoprecipitation with anti-FLAG conjugated agarose beads. Eluates were analyzed by mass spectrometry. The Log2 fold change of the mean LFQ intensity is plotted against −Log10 p-value (n = 3 technical replicates). The curve indicates significantly enriched proteins (FDR = 0.05, s0 = 1). Mitochondrial outer membrane proteins are labeled in orange with the annotation from MitoCarta 3.0. Corresponding data are available in the Supporting information (S3 Table). (B) AlphaFold [43] was used to predict the structure of Lpg1625, which was labeled with the RVxF motif and transmembrane domain (TMD) using ChimeraX [44]. The model has an average per-residue model confidence score (pLDDT) of 65.94, indicating low model confidence. (C) Mitochondria sub-fractionation and carbonate extraction were performed using mitochondria isolated from HeLa cells transiently transfected with FLAGRVxFdead. Mitochondria were either left intact (lanes 1 and 2), subjected to hypotonic swelling (lanes 3 and 4), or solubilized with 0.5% Triton X-100 (lanes 5 and 6). Samples treated with Proteinase K (PK) are indicated (+). For carbonate extraction, mitochondria were washed in a fresh solution of 0.1 M sodium carbonate and integral (pellet, P) and soluble (supernatant, S) proteins were separated using ultracentrifugation. Samples were analyzed using SDS-PAGE and immunoblotting using the indicated antibodies. Corresponding raw images are available in the Supporting information (S1 Raw Images). (D) Mitochondria isolated from wild-type HeLa cells or cells transiently transfected with FLAGRVxFdead were solubilized in 1% digitonin buffer prior to immunoprecipitation with anti-FLAG conjugated agarose beads. Eluates were processed for mass spectrometry. The Log2 fold change of mean LFQ intensity is plotted against −Log10 p-value (n = 3 technical replicates). The curve indicates significantly enriched proteins (FDR = 0.05, s0 = 1). Mitochondrial outer membrane proteins are labeled in orange with the annotation from MitoCarta3.0. Corresponding data are available in the Supporting Information (S3 Table). (E) HeLa cells expressing FLAGLpPIP, or FLAGRVxFdead were stained with 100 nM MitoTracker Deep Red FM (mitochondria; MTDR) and, following fixation, processed for immunofluorescence using antibodies against FLAG (green) and PPP1CB (magenta). Nuclei were stained with Hoechst 33258 (blue). Scale bar represents 10 μm. Fluorescence signal profiles of FLAG and PPP1CB were measured across the indicated line of interest. Corresponding raw data are available in the Supporting information (S1 Data). (F) The correlation between PPP1CB and FLAGLpPIP was assessed using the Pearson correlation coefficient (r) in HeLa cells expressing FLAGLpPIP or FLAGRVxFdead (n = 3 independent experiments, 45 cells in total). Data represent mean ± SEM of the three experiments represented in three different colors. Larger circles represent the mean values from each experiment, while smaller circles are values from individual cells. An unpaired t test on the means revealed a significant difference of 0.59 ± 0.02 between groups (p-value < 0.0001). Corresponding raw data are available in the Supporting information (S1 Data). (G) Proportion of PPP1CB localized to mitochondria in untransfected and HeLa cells transiently transfected with FLAGLpPIP or FLAGRVxFdead, was calculated using raw integrated density in Fiji. Representative images are shown in Fig 2E. Data are presented as mean ± SEM (n = 3 independent experiments, 5 cells each). Ordinary one-way ANOVA showed no significant difference between the groups. Corresponding raw data are available in the Supporting information (S1 Data). (H) AlphaFold3 predicted structure of LpPIP-PPP1CB complex (ipTM = 0.86; pTM = 0.85) labeled with the RVxF motif on LpPIP (green) and known RVxF binding pocket on PPP1CB (red). Image generated using ChimeraX [44]. (I) AlphaFold3 structure of LpPIP-PPP1CB complex labeled with the active site (purple) and three substrate binding grooves (yellow) of PPP1CB.
Fig 3
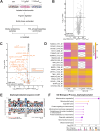
Fig 3. Recruitment of PP1 by LpPIP dephosphorylates mitochondrial proteins.
(A) Schematic of the phosphoproteomics workflow used in this study. Wild-type Flp-In T-REx 293 cells and stable cell lines expressing FLAGLpPIP or FLAGRVxFdead were induced with 1 µg/mL tetracycline for 24 h. Proteins from isolated mitochondria were trypsinized and cleaned by solid phase extraction before phosphopeptide enrichment using titanium dioxide (TiO2) beads. Global proteomics and phosphopeptide-enriched samples were analyzed by quantitative mass spectrometry and processed using Spectronaut and Perseus. (B) Scatterplot comparing mitochondrial protein abundance between Flp-In T-REx 293 stable cells expressing FLAGLpPIP or FLAGRVxFdead (n = 3 technical replicates). Log2 fold change of mean LFQ intensity is plotted against −Log10 p-value. Significance thresholds were set at ± 1.5-fold change and p-value = 0.01. Corresponding data are available in the Supporting information (S5 Table). (C) Scatterplot comparing mitochondrial phosphopeptide abundances between Flp-In T-REx 293 cells expressing FLAGLpPIP and FLAGRVxFdead (n = 3 technical replicates). Data was filtered for mitochondrial and mitochondrial-interacting proteins using the MitoCarta3.0 annotation and restricted to serine/threonine phosphopeptides. Significance thresholds were set at ± 1.5-fold change and p-value of 0.01 using Student t test. Phosphopeptides from mitochondrial outer membrane proteins are labeled in orange. Hollow circles indicate phosphopeptides with imputed values; solid circles represent those without. Corresponding data are available in the Supporting information (S5 Table). (D) Heatmap of the mitochondrial phosphopeptides significantly reduced in Flp-In T-REx 293 stable cells expressing FLAGLpPIP relative to wild-type (n = 4 technical replicates) and cells expressing FLAGRVxFdead (n = 3 technical replicates). Average of the Log2 abundance of phosphopeptide for each group was used to generate the heatmap in Prism 10. Missing values are indicated by crosses. Corresponding data are available in the Supporting information (S5 Table). (E) pLogo [56] sequence motif analysis of the seven residues flanking 39 phosphoserine/phosphothreonine (pSer/pThr) sites significantly dephosphorylated in FLAGLpPIP expressing cells (Fig 3C). Arginine (R) at position −3 relative to pSer/pThr was significantly enriched (log-odd probability of 6.213 and p-value of 1.715 e−4). (F) Gene ontology (GO) biological process enrichment analysis of mitochondrial proteins with significantly downregulated phosphopeptides (Fig 3D), performed using ShinyGO 0.80 [57]. The top 10 enriched GO terms are shown. Corresponding data are available in the Supporting information (S2 Data).
Fig 4
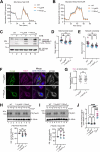
Fig 4. Downstream consequences of LpPIP-PP1 dephosphorylation events.
(A) Time course trace of oxygen consumption rate (OCR) in wild-type Flp-In T-REx 293 cells (16 technical replicates) and stable cells expressing FLAGLpPIP (15 technical replicates) or FLAGRVxFdead (15 technical replicates), following injections of oligomycin, FCCP, rotenone, and antimycin A. Data represents mean ± SD. Corresponding raw data are available in the Supporting Information (S3 Data). (B) Time course trace of extracellular acidification rate (ECAR) for the cells described in Fig 4A, following incubation with oligomycin and 2-deoxy-d-glucose. Data represents mean ± SD. Corresponding raw data are available in the Supporting Information (S3 Data). (C) Wild-type Flp-In T-REx 293 cells and stable cells expressing FLAGLpPIP or FLAGRVxFdead were induced with 1 µg/mL tetracycline for 24 h, followed by treatment with 1 µM staurosporine (STS) for 24 h. Whole cell samples were processed for SDS-PAGE and immunoblots. Corresponding raw images are available in the Supporting Information (S1 Raw Images). (D) Quantification of mitochondrial mean aspect ratio in wild-type HeLa cells and those transfected with FLAGLpPIP or FLAGRVxFdead (n = 3 independent experiments, 10 cells per experiment). Data are presented as mean ± SEM of the three experiments. Ordinary one-way ANOVA was performed on the means, showing a significant difference of 0.2273 between wild-type and FLAGLpPIP-transfected cells, with a p-value of 0.0309. Corresponding raw data are available in the Supporting information (S1 Data). (E) Quantification of mitochondrial mean form factor in HeLa cells and those transfected with FLAGLpPIP or FLAGRVxFdead (n = 3 independent experiments, 10 cells in each experiment). Data are presented as mean ± SEM of the three experiments. Ordinary one-way ANOVA was performed on the means, showing no significant differences among the groups. Corresponding raw data are available in the Supporting information (S1 Data). (F) HeLa cells transiently transfected with FLAGLpPIP, or FLAGRVxFdead were stained with 100 nM MitoTracker Deep Red FM (mitochondria; MTDR) and immunostained with antibodies against FLAG (green) and Drp1 (magenta). Nuclei were stained with Hoechst 33258 (blue). Scale bar represents 10 μm. (G) Proportion of Drp1 localized to mitochondria in HeLa cells transiently transfected with FLAGLpPIP or FLAGRVxFdead, calculated using raw integrated density in Fiji. Representative images are shown in Fig 3F. Data are presented as mean ± SD from 13 cells in one experiment. Unpaired t test showed no significant difference between the groups. Corresponding raw data are available in the Supporting information (S1 Data). (H) [35S]-Tim23 was imported into mitochondria isolated from wild-type Flp-In T-REx 293 cells and stable cells expressing FLAGLpPIP or FLAGRVxFdead. Following import mitochondria were isolated and treated with PK. Isolated mitochondria were solubilized in 1% [w/v] digitonin and the separated by BN-PAGE and observed by phosphor image analysis. Densitometric quantification was calculated as the percentage of import at 60 min in mitochondria from wild-type Flp-In T-REx 293 cells, normalized to SDHA loading control. Data are presented as mean ± SD of three experiments. Ordinary one-way ANOVA showed no significant difference among the three cell lines. Corresponding raw data are available in the Supporting Information (S1 Raw Images and S4 Data). (I) [35S]-GC1 was imported into mitochondria isolated from wild-type Flp-In T-REx 293 cells and stable cells expressing FLAGLpPIP or FLAGRVxFdead as described in Fig 4H. Densitometric quantification and ordinary one-way ANOVA showed no significant difference among the three cell lines. Corresponding raw data are available in the Supporting information (S1 Raw Images and S4 Data). (J) Quantification of mitophagy from live-cell imaging of Flp-In T-REx 293 cell lines constitutively expressing mt-Keima. Experimental conditions include wild-type Flp-In T-REx 293 cells cultured in normal media or media adjusted to pH 4 (positive control), and stable cells induced to express either FLAGLpPIP or FLAGRVxFdead. The 561/488 mt-Keima signal (red-to-green fluorescence ratio) was quantified using the Ratio Plus plugin in Fiji and normalized to that of wild-type cells in normal media. Data represent mean ± SEM from two to three independent experiments (>30 images per experiment). Statistical analysis by ordinary one-way ANOVA showed no significant differences among the cell lines, except for the pH 4 control. Corresponding raw data are available in the Supporting information (S1 Data).
Fig 5
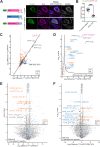
Fig 5. LpPIP does not specify substrates selectivity for PP1.
(A) HeLa cells transiently transfected with FLAGLpPIP or FLAGLpPIP-CYB5ATA were stained with 100 nM MitoTracker Deep Red FM (mitochondria; MTDR) and immunostained with antibodies against FLAG (green) and PDI (ER; magenta). Nuclei were stained with Hoechst 33258 (blue). Scale bar represents 10 μm. (B) Pearson correlation analysis of FLAG or PDI and PPP1CB fluorescence signals was performed on FLAGLpPIP-CYB5ATA expressing HeLa cells and untransfected wild-type HeLa cells (n = 3 independent experiments, 16 cells per experiment). Data are shown as the mean ± SEM of three independent experiments. Larger circles represent mean values from each experiment, and smaller circles represent individual cell values. Unpaired t test was performed on the means, revealing a significant difference of 0.35 ± 0.03 between the two groups, with a p-value of 0.0005. Representative images are shown in S4B Fig. Corresponding raw data are available in the Supporting information (S1 Data). (C) Whole cell FLAG co-immunoprecipitation was performed using untransfected HeLa cells, HeLa cells expressing FLAGLpPIP, or FLAGLpPIP-CYB5ATA (n = 3 technical replicates). The Log2 difference of proteins enriched in FLAGLpPIP and FLAGLpPIP-CYB5ATA relative to untransfected cells is shown. Proteins with significant fold change (± 1.5-fold change with a p-value ≤ 0.05) are represented as filled circles, while non-significant differences are shown as hollow circles. Mitochondrial proteins based on MitoCarta3.0 are indicated in orange, and ER proteins based on the Human Protein Atlas are indicated in blue. Corresponding data are available in the Supporting information (S6 Table). (D) Volcano plot showing proteins enriched following FLAG co-immunoprecipitation from HeLa cells expressing FLAGLpPIP-CYB5ATA compared to untransfected cells (n = 3 technical replicates). Mitochondrial proteins based on MitoCarta3.0 are indicated in orange, and ER proteins based on the Human Protein Atlas are indicated in blue. Corresponding data are available in the Supporting information (S6 Table). (E) Scatterplot comparing phosphopeptides abundances in whole cell samples from HeLa cells transfected with FLAGLpPIP to empty vector pCDNA5 (n = 4 technical replicates). Data were filtered for serine and threonine phosphopeptides. The significance thresholds were set to a ±1.5-fold change with a p-value of 0.01 using Student t test. Phosphopeptides derived from mitochondrial outer membrane proteins (MitoCarta3.0) and ER proteins (Human Protein Atlas) are labeled in orange and blue, respectively. Non-imputed phosphopeptides are shown as filled circles, while phosphopeptides with imputed values are shown as hollow circles. Corresponding data are available in the Supporting information (S7 Table). (F) Scatterplot comparing phosphopeptides abundances in whole cell samples from HeLa cells transfected with FLAGLpPIP-CYB5ATA to empty vector pCDNA5 (n = 4 technical replicates), processed as described in Fig 5E. Corresponding data are available in the Supporting information (S7 Table).

Similar articles

References

    1. Newton HJ, Ang DKY, van Driel IR, Hartland EL. Molecular pathogenesis of infections caused by Legionella pneumophila. Clin Microbiol Rev. 2010;23(2):274–98. doi: 10.1128/CMR.00052-09 - DOI - PMC - PubMed
    1. Escoll P, Rolando M, Gomez-Valero L, Buchrieser C. From amoeba to macrophages: exploring the molecular mechanisms of Legionella pneumophila infection in both hosts. Curr Top Microbiol Immunol. 2013;376:1–34. doi: 10.1007/82_2013_351 - DOI - PubMed
    1. Park JM, Ghosh S, O’Connor TJ. Combinatorial selection in amoebal hosts drives the evolution of the human pathogen Legionella pneumophila. Nat Microbiol. 2020;5(4):599–609. doi: 10.1038/s41564-019-0663-7 - DOI - PMC - PubMed
    1. Zhu W, Banga S, Tan Y, Zheng C, Stephenson R, Gately J, et al. Comprehensive identification of protein substrates of the Dot/Icm type IV transporter of Legionella pneumophila. PLoS One. 2011;6(3):e17638. doi: 10.1371/journal.pone.0017638 - DOI - PMC - PubMed
    1. Luo Z-Q, Isberg RR. Multiple substrates of the Legionella pneumophila Dot/Icm system identified by interbacterial protein transfer. Proc Natl Acad Sci U S A. 2004;101(3):841–6. doi: 10.1073/pnas.0304916101 - DOI - PMC - PubMed

MeSH terms

Substances

LinkOut - more resources