. 2025 Jul 25;11(30):eadw2937.
doi: 10.1126/sciadv.adw2937. Epub 2025 Jul 23.

Targeting tumor-associated CCR2+ macrophages to inhibit pancreatic cancer recurrence following irreversible electroporation

Affiliations

Targeting tumor-associated CCR2+ macrophages to inhibit pancreatic cancer recurrence following irreversible electroporation

Weichen Xu et al. Sci Adv. .

Abstract

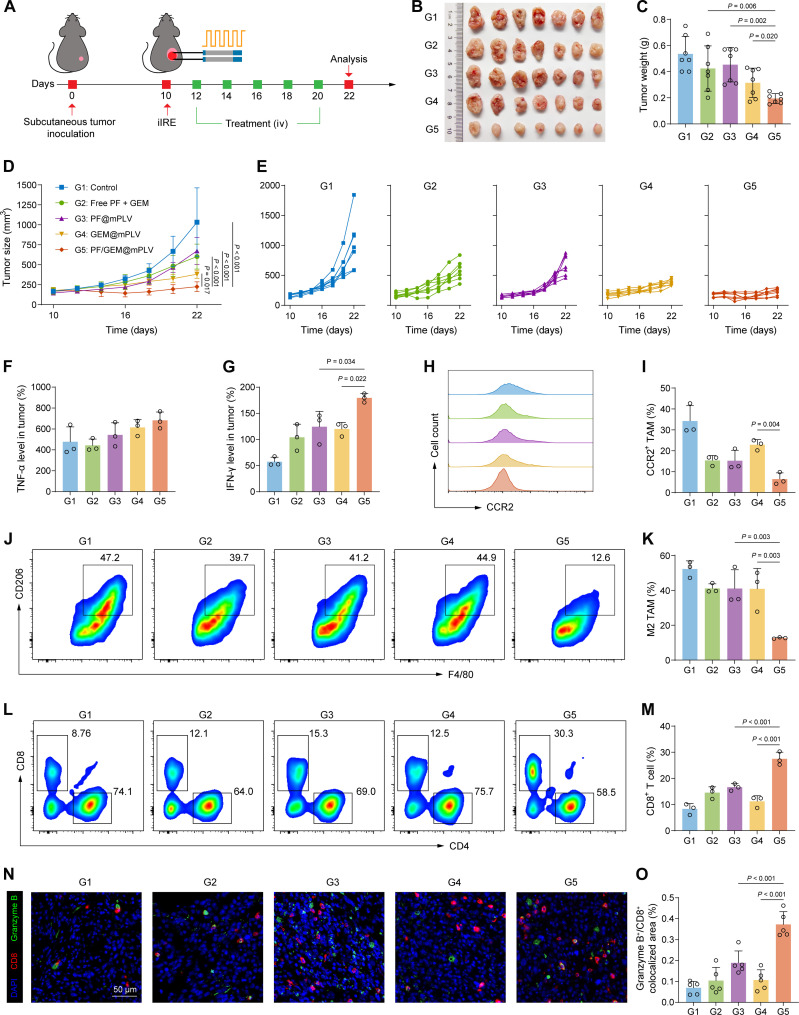
Pancreatic ductal adenocarcinoma (PDAC) is a highly lethal malignancy with pronounced resistance to conventional therapies. Irreversible electroporation (IRE) is a promising therapy for PDAC; however, its clinical efficacy is limited by a high recurrence rate. Here, using a preclinical PDAC model, we characterized the tumor immune microenvironment following insufficient IRE (iIRE) through single-cell RNA sequencing. We found that iIRE induces a CCR2+ tumor-associated macrophage (CCR2+ TAM)-mediated immunosuppressive microenvironment in residual tumors. Consequently, we developed a macrophage-based proteolipid vesicle (mPLV) coencapsulating the CCR2 antagonist PF-4136309 (PF) and gemcitabine (GEM), named PF/GEM@mPLV. Our findings suggest that PF/GEM@mPLV achieves high drug accumulation within tumors through iIRE-induced inflammation. Reduction of CCR2+ TAMs enhances antitumor immunity and improves chemotherapeutic response. PF/GEM@mPLV markedly inhibits tumor recurrence following iIRE, diminishes hepatic metastases, and prolongs survival in preclinical PDAC models. These findings uncover the role of CCR2+ TAMs in iIRE-induced immunosuppression, offering a promising strategy to enhance the clinical potential of IRE in PDAC.


Figures

Fig. 1.
Fig. 1.. Design and mechanism of CCR2-targeted proteolipid nanovesicles for inhibiting pancreatic cancer recurrence following IRE.
(A) Target identification using scRNA-seq. (B) Schematic illustration of the synthesis process of mPLVs loaded with CCR2 antagonist PF-4136309 (PF) and GEM, termed PF/GEM@mPLV. (C) Enhanced immune activation and cytotoxicity induced by PF/GEM@mPLV in combination with IRE therapy.
Fig. 2.
Fig. 2.. Characterization of the immunosuppressive microenvironment of PDAC following iIRE treatment.
(A) Experimental timeline for the subcutaneous KPC tumor model. (B) Tumor growth curve (n = 7). (C) Gross images of tumors. (D) Tumor weights (n = 7). (E) Uniform Manifold Approximation and Projection (UMAP) plot of eight cell types. (F) Heatmap of selected marker genes for different cell types. (G) Percentage of immune cells. (H) Reclustering of TAMs displayed by UMAP plot. (I) Proportion of seven TAM subclusters. (J) Violin plot displaying Ccr2 expression levels between the control and iIRE groups in TAMs. (K) Volcano plot showing the top 20 differentially expressed genes (DEGs) in TAMs between the control and iIRE groups; key genes are highlighted in bold; vertical dotted lines represent |log2 fold change| > 0.5. (L) Expression of selected genes belonging to the indicated categories in TAM subclusters. (M) Representative multiplex immunofluorescence (mIF) staining images of tumor sections (scale bars, 50 μm); 4′,6-diamidino-2-phenylindole (DAPI; blue), F4/80 (red), CCR2 (yellow), and CD8 (green). (N) Quantification of CCR2+F4/80+ colocalized pixels relative to the total area [n = 5 fields of view (FOVs)]. (O) Validation using quantitative polymerase chain reaction (qPCR) of Ccr2 expression in KPC tumors treated with or without iIRE (n = 3). Data are expressed as mean ± SD. Statistical differences were calculated using Student’s t test.
Fig. 3.
Fig. 3.. Validation of the immunosuppressive potential of CCR2+ TAM.
(A) Bubble plot showing the expression of immunosuppressive genes across seven TAM subclusters. (B) Immunosuppressive scores. (C) GSEA of the TGF-β signaling pathway in Ccr2+ TAMs between the control and iIRE groups. FDR, false discovery rate. NES, normalized enrichment score. (D) Gating strategy for flow cytometry and FACS of LYVE1+ TAMs, C1q+ TAMs, and CCR2+ TAMs. (E) Quantitative analysis of TAM subcluster proportions by flow cytometry (n = 3). (F) Schematic illustration of the CD8+ T cell suppression assay. (G) Representative histograms of carboxyfluorescein diacetate succinimidyl ester (CFSE)–labeled T cells. (H) Quantification of proliferating CD8+ T cells (n = 3). (I to K) Flow cytometric analysis of CD69+ (I), IFN-γ+ (J), and granzyme B+ (K) CD8+ T cells (n = 3). Data are expressed as mean ± SD. Statistical differences were calculated using two-way analysis of variance [ANOVA (E)] and one-way ANOVA (H to K).
Fig. 4.
Fig. 4.. Synthesis and characteristics of PF/GEM@mPLVs.
(A) Schematic diagram of the PF/GEM@mPLV synthesis process. (B and C) Representative TEM images of (B) liposome and (C) mPLV (scale bar, 100 nm). PI, polydispersity index. (D) Representative particle-size distributions of liposome, mPLV, and PF/GEM@mPLV. (E) Zeta potentials of liposome, mPLV, and PF/GEM@mPLV (n = 3). (F) Particle size variations over 7 days of liposome and PF/GEM@mPLV (n = 3). (G) SDS–polyacrylamide gel electrophoresis (SDS-PAGE) analysis of the protein composition of macrophage total proteins, macrophage membranes, liposomes, mPLVs, and PF/GEM@mPLVs, respectively. (H) Drug release curve of PF and GEM (n = 3). (I) Representative images of 1,1′-dioctadecyl-3,3,3′,3′-tetramethylindocarbocyanine perchlorate (DiI)–labeled particles internalized by macrophages (J774A.1 cell line) and KPC cells at different time points by confocal laser scanning microscope (CLSM; scale bar, 20 μm). h, hours. Data are expressed as mean ± SD.
Fig. 5.
Fig. 5.. In vitro assays of PF/GEM@mPLVs and validation of targeting capability.
(A and B) Cell viability of KPC cells treated with varying concentrations of GEM in (A) GEM@mPLVs or (B) PF/GEM@mPLVs. (C) Bar plots displaying CCL2 concentrations in the supernatants of mouse cell lines (J774A.1, KPC, 4T1, and CT26) and human cell lines (PANC-1 and KP-4) (n = 3). (D) Representative fluorescence images of J774A.1 cells stained with Fluo-4 AM. (E) Quantitative analysis of mean Fluo-4 fluorescence intensity (n = 3). (F) Schematic diagram of in vitro macrophage migration assay using a transwell system. (G and H) Representative images of migrated cells stained by crystal violet and quantification. (I) In vivo fluorescence images of KPC tumor–bearing mice captured at 0, 2, 4, 8, 24, and 48 hours after intravenous administration of Cy5.5-labeled PF/GEM@Liposome or PF/GEM@mPLV. (J) Representative ex vivo fluorescence images of major organs and tumors (H represents heart, Li represents liver, Lu represents lung, K represents kidney, T represents tumor, and S represents spleen) at 48 hours after administration of Cy5.5-labeled PF/GEM@Liposome or PF/GEM@mPLV. (K) Quantification of in vivo fluorescence (n = 3). (L) Quantification of nanoparticle biodistribution in major organs and tumor tissues, expressed as %ID/g (n = 3). (M) Representative fluorescence images of intratumoral permeation of Cy3-labeled nanoparticles in the whole tumor tissues 24 hours after injection. DAPI (blue) and Cy3 (red). Scale bars, 2000 μm (0.6× images) and 100 μm (20× images). Data are expressed as mean ± SD. Statistical differences were calculated using one-way ANOVA (C, E, and H) and two-way ANOVA (K and L).
Fig. 6.
Fig. 6.. PF/GEM@mPLVs suppress tumor recurrence in subcutaneous KPC tumors and modulate immune response.
(A) Schematic diagram of treatment strategy in subcutaneous KPC tumors. iv, intravenous. (B) Gross images of tumors in control (G1), free PF + GEM (G2), PF@mPLV (G3), GEM@mPLV (G4), and PF/GEM@mPLV (G5) groups. (C) Tumor weights in different treatment groups (n = 7). (D and E) Tumor growth curves (n = 7), from days 10 to 22. (F and G) Concentration of TNF-α and IFN-γ in tumor homogenates (n = 3). (H and I) Representative flow cytometric histogram of CCR2+ TAM (CCR2+Ly6GF4/80+CD11b+CD45+) and quantification (n = 3). (J and K) Representative flow cytometric analysis of M2-TAM (CD206hiLy6GF4/80+CD11b+CD45+) and quantification (n = 3). (L and M) Representative flow cytometric analysis of CD8+ T cell (CD8+CD3+CD45+) and quantification (n = 3). (N) Representative mIF images of tumor tissues showing DAPI (blue), CD8 (red), and granzyme B (green) (scale bar, 50 μm). (O) Quantification of granzyme B+CD8+ colocalized pixels relative to the total area (n = 5 FOVs). Data are expressed as mean ± SD. Statistical differences were calculated using one-way ANOVA.
Fig. 7.
Fig. 7.. PF/GEM@mPLVs suppress post-iIRE tumor recurrence and liver metastasis in orthotopic KPC tumors.
(A) Representative in vivo fluorescence images of orthotopic KPC tumor–bearing mice captured at 0, 2, 4, 8, 24, and 48 hours after intravenous administration of Cy5.5-labeled PF/GEM@mPLV. The image on the right shows ex vivo fluorescence images of major organs and tumors (T&S represents tumor and spleen) at 48 hours. (B) Quantification of in vivo fluorescence (n = 3). (C) Quantification of nanoparticle biodistribution in major organs and tumor tissue, expressed as %ID/g, 48 hours after administration (n = 3). (D) Schematic diagram of the treatment strategy in orthotopic KPC tumors. (E) Tumor growth in the orthotopic KPC tumor model measured by bioluminescence imaging (n = 6). (F) Tumor growth of the control group. (G) Tumor growth of the treated group. (H) Representative bioluminescence images of orthotopic KPC tumors for monitoring tumor growth in the control and treated groups. D, day. (I) Gross images of KPC tumors with spleens. (J) Tumor weights in the control and treated groups (n = 6). (K) Kaplan-Meier survival curves (n = 10). (L) Gross image of liver metastasis. (M) Representative image of H&E staining for liver metastases. Scale bars, 1 mm (1× images) and 200 μm (10× images). (N) Quantitative analysis of hematoxylin-stained area (n = 3). Data are expressed as mean ± SD. Statistical differences were calculated using Student’s t test.
Fig. 8.
Fig. 8.. Local and systemic immune responses in orthotopic KPC tumors.
(A to F) Flow cytometric analysis of CCR2+ TAM (CCR2+Ly6GF4/80+CD11b+CD45+), M2-TAM (CD206hiLy6GF4/80+CD11b+CD45+), CD8+ T cell (CD8+CD3+CD45+), granzyme B+CD8+ T cell (granzyme B+CD8+CD3+CD45+), IFN-γ+CD8+ T cell (IFN-γ+CD8+CD3+CD45+), and Treg cell (CD25+Foxp3+CD4+CD3+CD45+) (n = 3). (G) Representative mIF images of tumor tissues showing DAPI (blue), F4/80 (red), CCR2 (yellow), and CD8 (green) (scale bars, 50 μm). (H) Quantification of CCR2+F4/80+ colocalized pixels relative to the total area (n = 5 FOVs). (I) Quantification of CD8+ mean fluorescence intensity (MFI) relative to the total area (n = 5 FOVs). (J to M) Representative flow cytometric analysis and quantification of (J and K) CD8+ central memory T cell (CD8+ TCM cell; CD62L+CD44+CD8+) and CD8+ TEM cell (CD62LCD44+CD8+) subset and (L and M) CD4+ TCM cell (CD62L+CD44+CD4+) and CD4+TEM cell (CD62LCD44+CD4+) in naïve and treated mice (n = 3). Data are expressed as mean ± SD. Statistical differences were calculated using Student’s t test.

References

    1. Bray F., Laversanne M., Sung H. Y. A., Ferlay J., Siegel R. L., Soerjomataram I., Jemal A., Global cancer statistics 2022: GLOBOCAN estimates of incidence and mortality worldwide for 36 cancers in 185 countries. CA Cancer J. Clin. 74, 229–263 (2024). - PubMed
    1. Tempero M. A., Malafa M. P., Al-Hawary M., Behrman S. W., Benson A. B., Cardin D. B., Chiorean E. G., Chung V., Czito B., Del Chiaro M., Dillhoff M., Donahue T. R., Dotan E., Ferrone C. R., Fountzilas C., Hardacre J., Hawkins W. G., Klute K., Ko A. H., Kunstman J. W., LoConte N., Lowy A. M., Moravek C., Nakakura E. K., Narang A. K., Obando J., Polanco P. M., Reddy S., Reyngold M., Scaife C., Shen J., Vollmer C., Wolff R. A., Wolpin B. M., Lynn B., George G. V., Pancreatic adenocarcinoma, version 2.2021, NCCN Clinical Practice Guidelines in Oncology. J. Natl. Compr. Canc. Netw. 19, 439–457 (2021). - PubMed
    1. Stoffel E. M., Brand R. E., Goggins M., Pancreatic cancer: Changing epidemiology and new approaches to risk assessment, early detection, and prevention. Gastroenterology 164, 752–765 (2023). - PMC - PubMed
    1. Grossberg A. J., Chu L. C., Deig C. R., Fishman E. K., Hwang W. L., Maitra A., Marks D. L., Mehta A., Nabavizadeh N., Simeone D. M., Weekes C. D., Thomas C. R. Jr., Multidisciplinary standards of care and recent progress in pancreatic ductal adenocarcinoma. CA Cancer J. Clin. 70, 375–403 (2020). - PMC - PubMed
    1. Suker M., Beumer B. R., Sadot E., Marthey L., Faris J. E., Mellon E. A., El-Rayes B. F., Wang-Gillam A., Lacy J., Hosein P. J., Moorcraft S. Y., Conroy T., Hohla F., Allen P., Taieb J., Hong T. S., Shridhar R., Chau I., van Eijck C. H., Koerkamp B. G., FOLFIRINOX for locally advanced pancreatic cancer: A systematic review and patient-level meta-analysis. Lancet Oncol. 17, 801–810 (2016). - PMC - PubMed

MeSH terms