. 2025 Jul 25;11(30):eady2862.
doi: 10.1126/sciadv.ady2862. Epub 2025 Jul 23.

Metabotissugenic citrate biomaterials orchestrate bone regeneration via citrate-mediated signaling pathways

Affiliations

Metabotissugenic citrate biomaterials orchestrate bone regeneration via citrate-mediated signaling pathways

Hui Xu et al. Sci Adv. .

Abstract

Bone regeneration requires coordinated anabolic and catabolic signaling, yet the interplay between mammalian target of rapamycin complex 1 (mTORC1) and adenosine monophosphate-activated protein kinase (AMPK) pathways remains unclear. This study reveals that citrate, glutamine, and magnesium synergistically activate both pathways via calcium/calmodulin-dependent protein kinase kinase 2 (CaMKK2)- and protein kinase B (Akt)-dependent signaling, bypassing the traditional adenosine monophosphate (AMP)/adenosine triphosphate (ATP) sensing mechanism. This dual activation supports sustained energy metabolism during osteogenesis and challenges the canonical antagonism between mTORC1 and AMPK. We developed CitraBoneQMg, a citrate-based biomaterial incorporating these components via one-pot synthesis. CitraBoneQMg provides sustained release, photoluminescent and photoacoustic imaging capabilities, and tunable mechanical properties. In vitro, it promotes osteogenesis by enhancing alkaline phosphatase (ALP) activity, osteogenic gene expression, and calcium deposition. In vivo, it accelerates bone regeneration in a rat calvarial defect model while promoting anti-inflammatory and neuroregenerative responses. We define this integrated effect as "metabotissugenesis," offering a metabolically optimized approach to orthopedic biomaterial design.


Figures

Fig. 1.
Fig. 1.. Schematic illustration of composites fabrication procedures for bone regeneration with metabolic effect and involved signaling pathways.
Figure created in BioRender [https://BioRender.com/tciloza; Hui Xu (2025)]. CaMMKβ, calcium/calmodulin-dependent protein kinase kinase β; mTORC1, mammalian target of rapamycin complex 1; AMPK, and adenosine monophosphate–activated protein kinase; ACO2, aconitase 2. ATP, adenosine triphosphate; NAD, nicotinamide adenine dinucleotide; NADH, reduced form of NAD+; CoA, coenzyme A; IDH, isocitrate dehydrogenase; SDH, succinate dehydrogenase; FAD, flavin adenine dinucleotide; ADP, adenosine diphosphate.
Fig. 2.
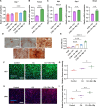
Fig. 2.. Individual supplementation of glutamine and magnesium enhanced osteogenesis.
(A) ALP activity on day 7 of osteogenic differentiation with various glutamine concentrations. Data are average ± SD. One-way ANOVA with Tukey’s multiple comparisons test, *P < 0.05, **P < 0.005, ***P < 0.0005, and ****P < 0.0001. n = 4. (B) mRNA expression of Runx2 on day 4 of hBM-MSCs osteogenic differentiation with various glutamine concentrations. Data are average ± SD. One-way ANOVA with Tukey’s multiple comparisons test, *P < 0.05, **P < 0.005, ***P < 0.0005, and ****P < 0.0001. n = 3. (C to F) mRNA expression of Alpl, Sp7, Spp1, and Ibsp on day 7 of hBM-MSCs osteogenic differentiation with various glutamine concentrations. Data are average ± SD. One-way ANOVA with Tukey’s multiple comparisons test, *P < 0.05, **P < 0.005, ***P < 0.0005, and ****P < 0.0001. n = 3. (G and H) Representative images and quantification of calcium nodules deposition (red) with various glutamine concentrations on day 14 of hBM-MSCs osteogenic differentiation. Scale bar, 500 μm. Data are average ± SD. One-way ANOVA with Tukey’s multiple comparisons test, *P < 0.05, **P < 0.005, ***P < 0.0005, and ****P < 0.0001. n = 4. (I) ALP activity on day 7 of osteogenic differentiation with various magnesium concentrations. Data are average ± SD. One-way ANOVA with Tukey’s multiple comparisons test, *P < 0.05, **P < 0.005, ***P < 0.0005, ****P < 0.0001. n = 4. (J) mRNA expression of Runx2 on day 4 of hBM-MSCs osteogenic differentiation with various magnesium concentrations. (K to M) mRNA expression of Alpl, Spp1, and Col1a1 on day 7 of hBM-MSCs osteogenic differentiation with various magnesium concentrations. Data are average ± SD. One-way ANOVA with Tukey’s multiple comparisons test, *P < 0.05, **P < 0.005, ***P < 0.0005, and ****P < 0.0001. n = 3. (N and O) Representative images and quantification of calcium nodules deposition (red) with various magnesium concentrations on day 14 of hBM-MSCs osteogenic differentiation. Scale bar, 500 μm. Data are average ± SD. One-way ANOVA with Tukey’s multiple comparisons test, *P < 0.05, **P < 0.005, ***P < 0.0005, and ****P < 0.0001. n = 3. OD, optical density.
Fig. 3.
Fig. 3.. Supplementation of citrate, glutamine, and magnesium synergistically enhanced osteogenesis.
(A) ALP activity on day 7 of osteogenic differentiation with control, 200 μM citrate (CA), 200 μM citrate + 8 mM magnesium (CA + Mg), 200 μM citrate + 1.5 mM glutamine (CA + Gln), or 200 μM citrate + 1.5 mM glutamine + 8 mM magnesium (CA + Gln + Mg). Data are average ± SD. One-way ANOVA with Tukey’s multiple comparisons test, *P < 0.05, **P < 0.005, ***P < 0.0005, and ****P < 0.0001. n = 3. (B) mRNA expression of Runx2 on day 4 of hBM-MSCs osteogenic differentiation with CA or CA + Gln + Mg. Data are average ± SD. Two-tailed unpaired t test, *P < 0.05, **P < 0.005, ***P < 0.0005, and ****P < 0.0001. n = 3. (C) mRNA expression of Spp1, ALPL, and BMP2 on day 7 of hBM-MSCs osteogenic differentiation with CA or CA + Gln + Mg. Data are average ± SD. Two-tailed unpaired t test, *P < 0.05, **P < 0.005, ***P < 0.0005, and ****P < 0.0001. n = 3. (D and E) Representative images and quantification of calcium nodules deposition (red) with control, CA, CA + Mg, CA + Gln, or CA + Gln + Mg on day 14 of hBM-MSCs osteogenic differentiation. Scale bar, 500 μm. Data are average ± SD. One-way ANOVA with Tukey’s multiple comparisons test, *P < 0.05, **P < 0.005, ***P < 0.0005, and ****P < 0.0001. n = 3. (F and G) Representative images and quantification of ALP (green) immunofluorescence staining with DAPI nuclear counterstain (blue) on day 7 of hBM-MSCs osteogenic differentiation with control, CA or CA + Gln + Mg. Scale bar, 200 μm. (H and I) Representative images and quantification of OPN (red) immunofluorescence staining with DAPI nuclear counterstain (blue) on day 14 of hBM-MSCs osteogenic differentiation with control, CA, or CA + Gln + Mg. Scale bar, 200 μm. Data are average ± SD. One-way ANOVA with Tukey’s multiple comparisons test, *P < 0.05, **P < 0.005, ***P < 0.0005, and ****P < 0.0001. n = 3. OPN, osteopontin.
Fig. 4.
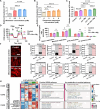
Fig. 4.. Supplementation of citrate, glutamine, and magnesium synergistically enhanced energy metabolism.
(A) Intracellular ATP level on day 7 of hBM-MSC osteogenic differentiation with various glutamine concentrations. Data are average ± SD. One-way ANOVA with Tukey’s multiple comparisons test, *P < 0.05, **P < 0.005, ***P < 0.0005, and ****P < 0.0001. n = 3 to 6. (B) Intracellular ATP level on day 7 of hBM-MSC osteogenic differentiation with various magnesium concentrations. Data are average ± SD. One-way ANOVA with Tukey’s multiple comparisons test, *P < 0.05, **P < 0.005, ***P < 0.0005, and ****P < 0.0001. n = 4. (C) Intracellular ATP level on day 7 of hBM-MSC osteogenic differentiation with control, CA, CA + Mg, CA + Gln, or CA + Gln + Mg. Data are average ± SD. One-way ANOVA with Tukey’s multiple comparisons test, *P < 0.05, **P < 0.005, ***P < 0.0005, and ****P < 0.0001. n = 3 to 5. (D) OCR profile plot, (E) basal respiration, maximal respiration, ATP production, and proton leak at day 7 of hBM-MSCs ostegeogenic differentiation with control, CA, or CA + Gln + Mg. Data are average ± SD. One-way ANOVA with Tukey’s multiple comparisons test, *P < 0.05, **P < 0.005, ***P < 0.0005, and ****P < 0.0001. n = 4. (F) Representative images of mitochondria membrane potential on day 7 of hBM-MSCs osteogenic differentiation with control, CA, or CA + Gln + Mg. Scale bar, 50 μm. (G) Intracellular levels of metabolites in TCA cycle on day 3 of hBM-MSCs osteogenic differentiation with control, CA, or CA + Gln + Mg. (H) Heatmap illustrating the intensity value distribution of 138 differential metabolites (DMs) across groups with CA, Gln, Mg, or CA + Gln + Mg. The significantly enriched KEGG pathways and their associated key metabolites from each cluster were displayed on the right side of the heatmap. Rot/AA, rotenone/antimycin A; FCCP, carbonyl cyanide p-trifluoromethoxyphenylhydrazone.
Fig. 5.
Fig. 5.. Supplementation of citrate, glutamine, and magnesium activated energy-related signaling pathways.
(A) Protein expression of p70-S6K-pT389, AMPKα-pT172, and AKT-pT308 at different days of hBM-MSCs osteogenic differentiation. (B) Protein expression of p70-S6K-pT389 and AMPKα-pT172 on day 3 of hBM-MSCs osteogenic differentiation with different treatments. (C) Protein expression of p70-S6K-pT389 on day 3 of hBM-MSCs osteogenic differentiation with Torin1 followed by different treatments. (D) Principal components analysis (PCA) of metabolomic data of hBM-MSCs osteogenic differentiation with different treatment conditions (left), and the intensity value distribution of ATP in the samples (right). The arrows denote the direction of three effects after different treatments. (E) ALP activity on day 7 of hBM-MSCs osteogenic differentiation without (NT) or with STO609 followed by without (control) or with CA + Gln + Mg treatment. Data are average ± SD. Two-tailed unpaired t test, *P < 0.05, **P < 0.005, ***P < 0.0005, and ****P < 0.0001. n = 4. (F) Protein expression of AMPKα-pT172 on day 3 of hBM-MSCs osteogenic differentiation with STO609, followed by different treatments. (G) Protein expression of p70-S6K-pT389 on day 3 of hBM-MSCs osteogenic differentiation with or without STO609, followed by different treatments. (H) Protein expression of p70-S6K-pT389 on day 3 of hBM-MSCs osteogenic differentiation with MK2206 followed by different treatments. (I) ALP activity on day 7 of hBM-MSCs osteogenic differentiation without (NT) or with MK2206 followed by without (control) or with CA + Gln + Mg treatment. Data are average ± SD. Two-tailed unpaired t test, *P < 0.05. n = 4. n.s., not significant. (J) Protein expression of AKT-pT308 on day 3 of hBM-MSCs osteogenic differentiation with different treatments. (K) Expression of core genes in the CaMKK2 pathway (CaMKK2), AMPK pathway (PRKAA1), AKT pathway (AKT1), and mTOR pathway (MTOR, RPTOR, and RPS8KB1) within the human osteogenic population. (L) Schematic representation of the mTOR-AMPK network with citrate, glutamine, and magnesium supplementations. Figure created in BioRender [https://BioRender.com/a90y633; Hui Xu (2025)].
Fig. 6.
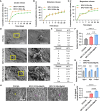
Fig. 6.. Material characterization of BPLP-Gln-Mg.
(A) Compressive stress of POC, BPLP-0.3Gln, BPLP-0.3Gln-Mg, BPLP-0.5Gln, and BPLP-0.5Gln-Mg composites. Data are average ± SD. One-way ANOVA with Tukey’s multiple comparisons test, *P < 0.05, **P < 0.005, ***P < 0.0005, and ****P < 0.0001. n = 4. (B) Compressive stress, (C) modulus, and (D) compressive strain of composites with incorporation of various magnesium amounts. Data are average ± SD. One-way ANOVA with Tukey’s multiple comparisons test, *P < 0.05, **P < 0.005, ***P < 0.0005, and ****P < 0.0001. n = 4 to 6. (E) Modulus and (F) compressive strain of POC and BPLP composites with incorporation of various glutamine amounts. Data are average ± SD. One-way ANOVA with Tukey’s multiple comparisons test. *P < 0.05, **P < 0.005, ***P < 0.0005, and ****P < 0.0001, n = 4. (G) Modulus and (H) compressive strain of BPLP-0.5Gln with or without magnesium incorporation. Data are average ± SD. Two-tailed unpaired t test, *P < 0.05, **P < 0.005, ***P < 0.0005, and ****P < 0.0001. n = 4. (I) Degradation of POC, BPLP-0.3Gln, BPLP-0.3Gln-Mg, BPLP-0.5Gln, and BPLP-0.5Gln-Mg films in PBS over time. n = 3. (J) Excitation and emission of POC film and BPLP films with various glutamine amounts. (K) Excitation and emission of BPLP-0.3Gln film and BPLP-0.5Gln films with magnesium incorporation. (L) Emission spectra of BPLP-0.3Gln film. (M) Emission spectra of BPLP-0.3Gln-Mg film. (N) Emission spectra of BPLP-0.5Gln film. (O) Emission spectra of BPLP-0.5Gln-Mg film. (P) Ultrasound (US) image (above) and 3D photoacoustic (PA) image (below) of POC, BPLP-0.3Gln, BPLP-0.5Gln, BPLP-0.3Gln-Mg, and BPLP-0.5Gln-Mg films from left to right at 808-nm wavelength. Scale bars, 3 mm. (Q) Quantitative analysis of the 3D photoacoustic image at 808-nm wavelength. a.u., arbitrary unit.
Fig. 7.
Fig. 7.. In vitro bioactivity evaluation of BPLP-Gln-Mg materials.
(A to C) Release of citrate, glutamine, and magnesium from BPLP-0.3Gln-Mg and BPLP-0.5Gln-Mg films over time. n = 3. (D) SEM images and EDS analysis of calcium nodule formation on day 21 of hBM-MSCs osteogenic differentiation on various composites. Right images are zoom-in of the yellow rectangles on the left accordingly. Scale bars, 50 μm (left) and 20 μm (right). (E) EDS quantification of corresponding composites on day 21 of hBM-MSCs osteogenic differentiation. (F) ALP activity on day 7 of hBM-MSCs osteogenic differentiation on various composites. Data are average ± SD. One-way ANOVA with Tukey’s multiple comparisons test, *P < 0.05, **P < 0.005, ***P < 0.0005, ****P < 0.0001. n = 4. (G) Osteogenic mRNA expression of Spp1, Alpl, and Col1a1 on day 7 in hBM-MSCs undergoing osteogenic differentiation on various composites. Data are average ± SD. Two-tailed unpaired t test, *P < 0.05, **P < 0.005, ***P < 0.0005, ****P < 0.0001, n = 3. (H) SEM images of Raw 264.7 cells on POC, BPLP-0.3Gln-Mg and BPLP-0.5Gln-Mg composites. Scale bar, 50 μm. Representative M1 and M2 morphology is highlighted in yellow and magenta, respectively. (I) IL-10 release of Raw 264.7 cells grown for 3 days on POC, BPLP-0.3Gln-Mg and BPLP-0.5Gln-Mg composites. Data are average ± SD. One-way ANOVA with Tukey’s multiple comparisons test, **P < 0.005, ***P < 0.0005, ****P < 0.0001. n = 3.
Fig. 8.
Fig. 8.. In vivo new bone formation in a rat calvarial bone defect model.
(A) Micro-CT images of calvaria defects with PLGA/HA, POC/HA, and BPLP-Gln-Mg/HA scaffolds at 6 and 12 weeks post-surgery. Scale bar, 1 mm. (B to E) Quantitative analysis of new bone formation at 6 (B and D) and 12 weeks (C and E). BV/TV, bone volume/tissue volume; BMD, bone marrow density. Data are average ± SD. One-way ANOVA with Tukey’s multiple comparisons test, *P < 0.05, ***P < 0.0005, ****P < 0.0001. n = 3. (F) H&E and Masson’s trichrome (MT) staining of calvaria bone samples at 6 and 12 weeks post-surgery. Scale bars, 1 mm (zoom out) and 50 μm (zoom in) (M, material; F, fibrosis tissue; NB, new bone).
Fig. 9.
Fig. 9.. Immunohistochemistry staining of OCN, Runx2, CD206, and TUBB3 at the defect site at week 6 and week 12.
Red arrow indicates representative area with positive staining. Scale bar, 50 μm.

Similar articles

References

    1. Liu H., Du Y., St-Pierre J.-P., Bergholt M. S., Autefage H., Wang J., Cai M., Yang G., Stevens M. M., Zhang S., Bioenergetic-active materials enhance tissue regeneration by modulating cellular metabolic state. Sci. Adv. 6, eaay7608 (2020). - PMC - PubMed
    1. Wang Z., Hu J., Marschall J. S., Yang L., Zeng E., Zhang S., Sun H., Antiaging metabolite-based polymeric microparticles for intracellular drug delivery and bone regeneration. Small Sci. 4, 2400201 (2024). - PMC - PubMed
    1. Qiao W., Wong K. H. M., Shen J., Wang W., Wu J., Li J., Lin Z., Chen Z., Matinlinna J. P., Zheng Y., Wu S., Liu X., Lai K. P., Chen Z., Lam Y. W., Cheung K. M. C., Yeung K. W. K., TRPM7 kinase-mediated immunomodulation in macrophage plays a central role in magnesium ion-induced bone regeneration. Nat. Commun. 12, 2885 (2021). - PMC - PubMed
    1. Ma C., Kuzma M. L., Bai X., Yang J., Biomaterial-based metabolic regulation in regenerative engineering. Adv. Sci. 6, 1900819 (2019). - PMC - PubMed
    1. Xu H., Yan S., Gerhard E., Xie D., Liu X., Zhang B., Shi D., Ameer G. A., Yang J., Citric acid: A nexus between cellular mechanisms and biomaterial innovations. Adv. Mater. 36, e2402871 (2024). - PMC - PubMed

LinkOut - more resources