. 2025 Jul 25;11(30):eadv6990.
doi: 10.1126/sciadv.adv6990. Epub 2025 Jul 23.

Engineering hybrid nanoparticles for targeted codelivery of triptolide and CYP3A4-siRNA against pulmonary metastatic melanoma

Affiliations

Engineering hybrid nanoparticles for targeted codelivery of triptolide and CYP3A4-siRNA against pulmonary metastatic melanoma

Yongwei Gu et al. Sci Adv. .

Abstract

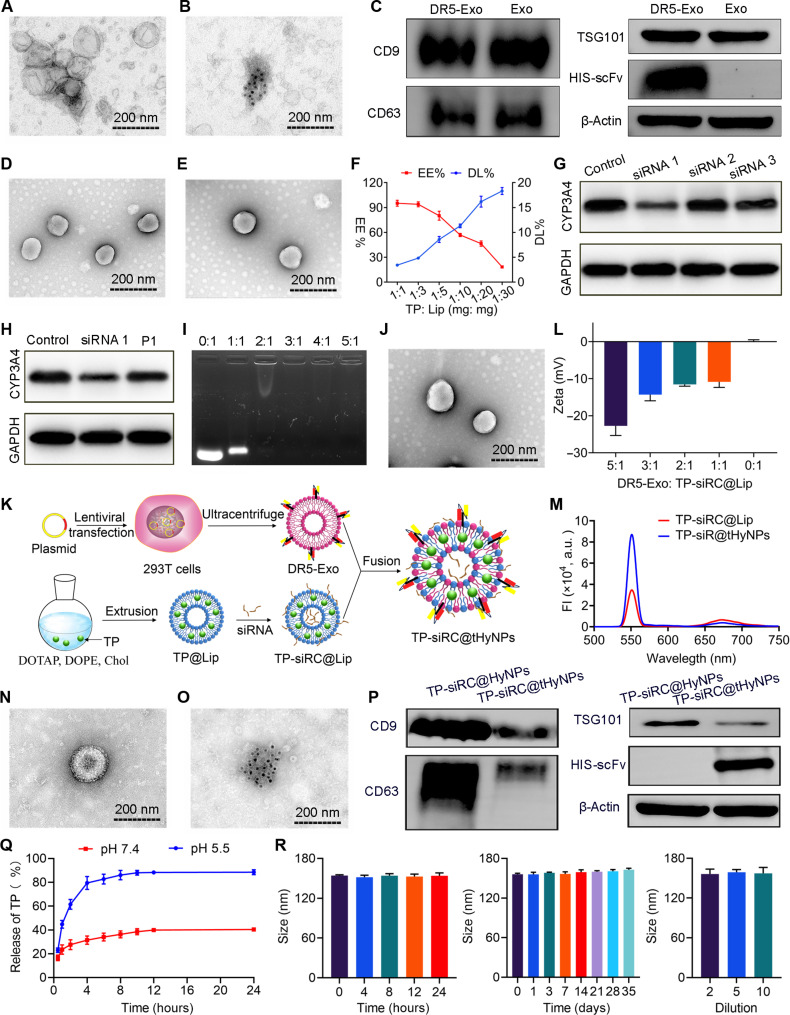
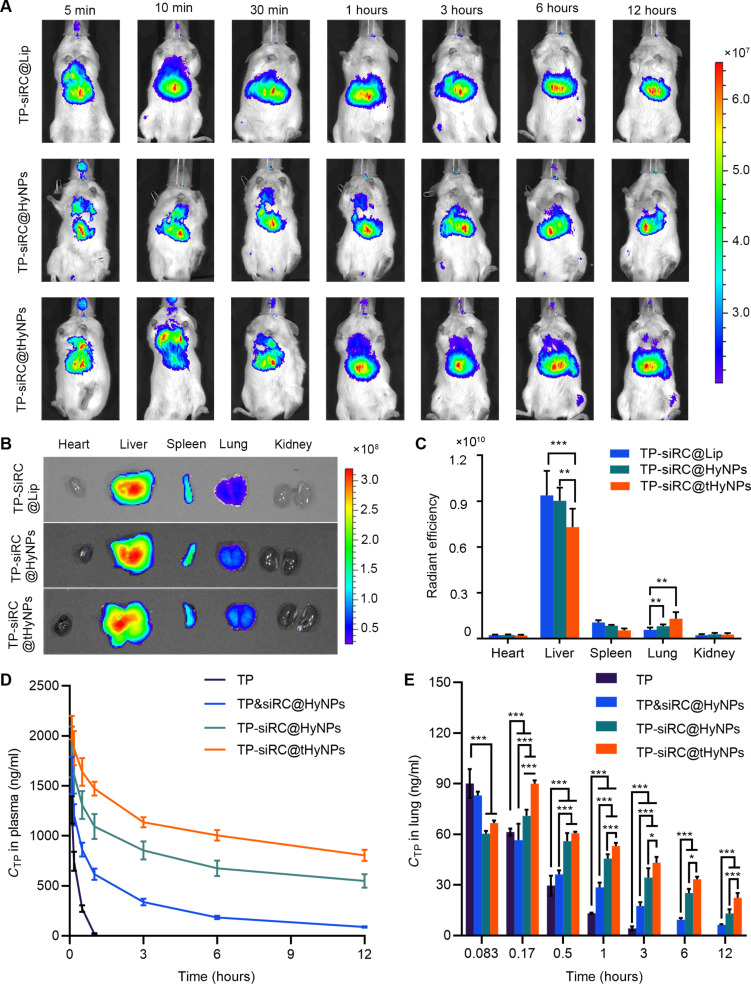
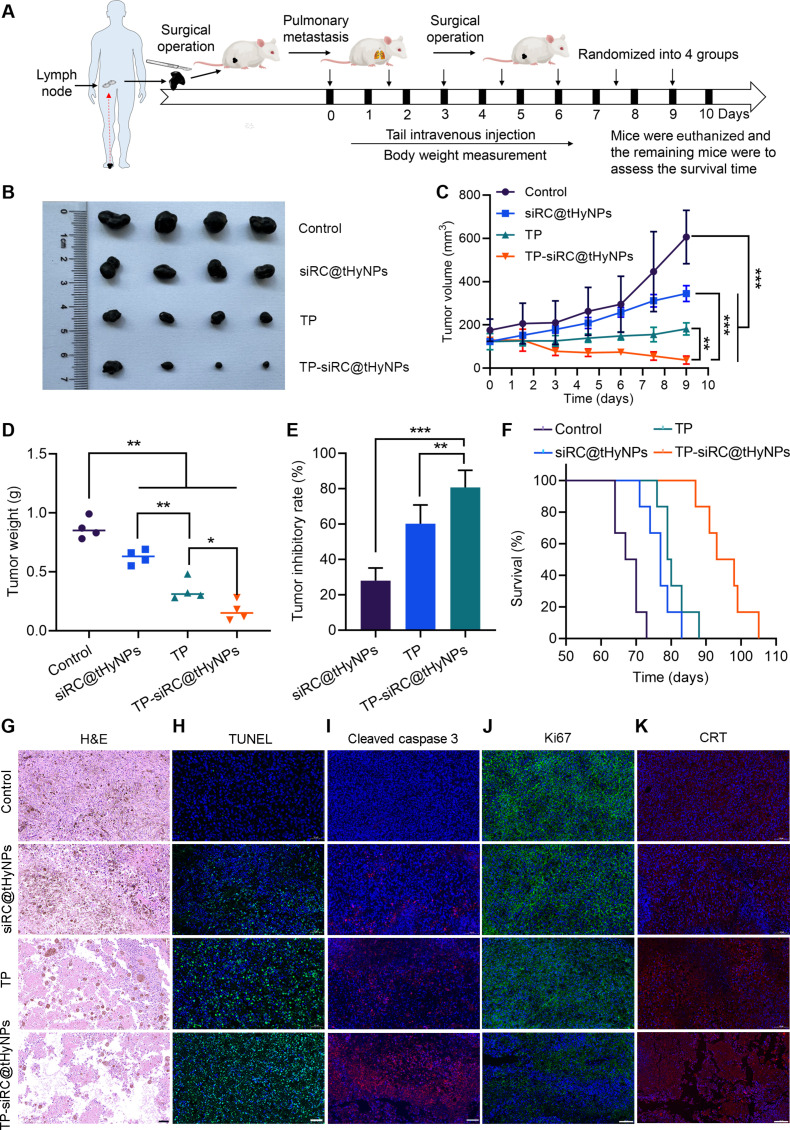
Pulmonary metastatic melanoma (PMM) is an aggressive malignancy with limited response and rapid resistance to clinical chemotherapy, radiotherapy, immunotherapy, and biological therapies. Here, we developed a targeted biomimetic drug delivery system, TP-siRC@tHyNPs, by fusing exosomes derived from engineered cells overexpressing DR5 single-chain variable fragments (DR5-Exo) with liposomes coencapsulating triptolide (TP) and CYP3A4-siRNA (TP-siRC@Lip). DR5-Exo facilitated the targeted delivery of drug to tumor cells through DR5 receptor recognition and simultaneously activated apoptotic pathways. Moreover, CYP3A4-siRNA effectively prolonged the half-life of TP, thereby enhancing its antiproliferative and pro-apoptotic effects. Mechanistic studies revealed that TP-siRC@tHyNPs induced immunogenic cell death, reprogrammed macrophage polarization, arrested cell cycle progression, and triggered apoptotic pathways. In vivo experiments demonstrated that TP-siRC@tHyNPs specifically accumulated in lung tissue, notably inhibiting the growth of PMM while exhibiting negligible toxicity in tumor-bearing mice. Overall, this study provides a promising strategy for targeting PMM treatment, improving therapeutic efficacy while reducing off-target toxicity.


Figures

Fig. 1.
Fig. 1.. Schematic illustration of TP-siRC@tHyNPs facilitating targeted drug delivery and synergistic effects against PMM.
(A) Preparation of TP-siRC@tHyNPs involves the fusion of DR5-Exo and TP-siRC@Lip membranes. (B) TP-siRC@tHyNPs were administered to tumor-bearing mice via tail vein injection, with DR5-scFv facilitating their targeted accumulation in tumor tissues. This delivery system successfully evades lysosomal degradation, enabling CYP3A4-siRNA to inhibit TP metabolism and thereby enhance its cytotoxicity. Concurrently, TP and DR5-scFv synergistically exert potent antitumor effects against PMM.
Fig. 2.
Fig. 2.. Construction and antitumor effect of DR5-scFv.
(A) Molecular docking analysis of DR5-scFv with DR5 protein. (a and b) Predicted DR5-scFv 3D structures of Model 01 and Model 02. (c) Contact interface between DR5-scFv molecules and the DR5 protein (DR5 protein is shown in red; the interaction interfaces of Models 01 and 02 are shown in yellow and green, respectively). (d and e) Hydrogen bonding interfaces between Models 01 and 02 (green) and the DR5 protein (red). (B and C) CBB staining and WB analysis of DR5-scFv (M, marker; Me, culture medium; FT, flow-through; W, wash; E, eluent). (D) Affinity signal between DR5-scFv and DR5 protein. (E) DR5-scFv gene expression level in 293T-DR5-scFv cells (N = 3). (F) CBB staining for analyzing the expression of DR5-scFv (M, marker; E, eluent). (G) Schematic representation of the treatment process. (H) Representative images of solid tumors harvested posttreatment (N = 4). (I) Weight of tumors excised from nude mice (N = 4). (J) Tumor volume growth curves of mice during the experiment (N = 4). (K) H&E images of tumor tissues from different groups. (L) TUNEL staining of tumor tissues from different groups. Scale bar, 50 μm. Means ± SD, *P < 0.05.
Fig. 3.
Fig. 3.. Preparation and characterization of TP-siRC@tHyNPs.
(A and B) TEM image and immunoelectron microscopy image of DR5-Exo. (C) WB analysis for DR5-Exo and Exo (HIS-tag was cotransfected to facilitate detection). (D) TEM of Lip. (E) TEM of TP@Lip. (F) Effect of the drug-to-lipid ratio on EE% and DL% of TP@Lip. (G) WB analysis of CYP3A4 protein expression in cells treated with different siRNA sequences targeting CYP3A4. GAPDH, glyceraldehyde-3-phosphate dehydrogenase. (H) WB analysis of CYP3A4 protein expression in normal A375M cells, siRNA-CYP3A4 treated cells, and the passaging 1 cells after treatment with siRNA-CYP3A4. (I) AGE results of TP-siRC@Lip prepared at various N/P ratios. (J) TEM of TP-siRC@Lip. (K) Schematic illustration of TP-siRC@tHyNPs preparation. (L) Zeta potential of TP-siRC@tHyNPs prepared at different DR5-Exo to TP-siRC@Lip ratios. (M) FRET confirming the fusion between TP-siRC@Lip and DR5-Exo. a.u., arbitrary units. (N and O) TEM and immunoelectron microscopy images of TP-siRC@tHyNPs. (P) WB analysis of characteristic proteins in TP-siRC@tHyNPs and TP-siRC@HyNPs (HIS-tag was cotransfected to facilitate detection). (Q) Drug release profiles of TP-siRC@tHyNPs under pH 5.5 and pH 7.4. (R) Stability analysis of TP-siRC@tHyNPs was conducted in plasma over 24 hours, in PBS for 35 days, and after dilution with PBS. N = 3, means ± SD.
Fig. 4.
Fig. 4.. Intracellular uptake, distribution, and metabolic analysis.
(A) Intracellular distribution of fluorescently labeled TP-siRC@Lip, Exo, and DR5-Exo in A375M cells. (B) Intracellular distribution of TP-siRC@HyNPs and TP-siRC@tHyNPs in A375M cells. (C) Quantitative fluorescence intensity analysis of liposomes (red) and Exo (green) in different treatment groups. (D) Flow cytometry analysis of the intracellular fluorescence intensity in A375M cells treated with TP-siRC@tHyNPs at various time points. (E) Drug concentration–time curves for TP of different treatment groups in A375M cells. N = 3, means ± SD, **P < 0.01; ***P < 0.001.
Fig. 5.
Fig. 5.. In vitro antitumor activity assessment.
(A) Viability of A375M cells after 24-hour exposure to different treatment groups. (B) Cell viability of A375M cells treated with TP, TP&siRC@HyNPs, TP-siRC@HyNPs, and TP-siRC@tHyNPs at a TP concentration of 50 ng/ml. (C) Apoptosis assay in 3D tumor spheroids models subjected to different treatments (scale bar, 500 μm). (D) Flow cytometry analysis of A375M cell apoptosis following different treatments. PI, propidium iodide, (E) Anti-invasion effects on A375M cells of different groups by Transwell assay (scale bar, 10 μm). (F) Cell migration assay of A375M cells with different treatments (scale bar, 100 μm). (G) Quantitative fluorescence intensity analysis of 3D tumor spheroids. (H to J) Quantitative analysis of apoptotic percentages, invasion rates, and migration rates of A375M cells in different treatment groups. N = 3, means ± SD, *P < 0.05; **P < 0.01; ***P < 0.001.
Fig. 6.
Fig. 6.. Investigation of underlying antitumor mechanisms in vitro.
(A) CLSM images showing CRT exposure in A375M cells with different treatments (scale bar, 20 μm). (B) CLSM images of HMGB1 in A375M cells (scale bar, 20 μm). (C) FCM analysis of CD80+ and CD86+ cells in BMDCs with different treatments. (D) FCM analysis of M2 macrophage markers CD206+ F4/80+ expression of different treatments. (E) Cell cycle distribution of different groups. (F) WB analysis of apoptosis-related protein expression in A375M cells. N = 3, means ± SD.
Fig. 7.
Fig. 7.. In vivo pharmacokinetics and biodistribution of TP-siRC@tHyNPs.
(A) Fluorescence imaging of mice with lung metastatic melanoma treated with TP-siRC@Lip, TP-siRC@HyNPs, and TP-siRC@tHyNPs at specific time intervals. (B) Ex vivo fluorescence images of isolated tissues at 12 hours postadministration. (C) Quantitative analysis of fluorescence intensity in isolated tissues. (D) Plasma drug concentration–time curves of TP, TP&siRC@HyNPs, TP-siRC@HyNPs, and TP-siRC@tHyNPs. (E) TP concentration in lung tissues at predetermined postadministration time points. N = 3, means ± SD, *P < 0.05; **P < 0.01; ***P < 0.001.
Fig. 8.
Fig. 8.. In vivo anti-PMM assessment.
(A) Schematic representation of the administration schedule. (B) Representative images of harvested lung tissues posttreatment. (C) H&E staining of the whole lung sections. (D) Enlarged view of local lung sections under high magnification (scale bar, 40 μm). (E) Ki67 staining of lung tissue sections (scale bar, 100 μm). (F) Cleaved caspase 3 expression in different groups (scale bar, 100 μm). (G). TUNEL assay images showing apoptotic cells in lung tissues from different treatment groups (scale bar, 50 μm). (H) CRT immunostaining of lung sections in different groups (scale bar, 100 μm). (I) Quantification of TNMN in the lungs of different treatment groups (N = 6). (J) Survival curves of tumor-bearing mice. Means ± SD, *P < 0.05; ***P < 0.001.
Fig. 9.
Fig. 9.. In vivo anti-PDX efficacy of TP-siRC@tHyNPs.
(A) Schematic of the administration schedule. (B) Representative images of harvested tumors from PBS, siRC@tHyNPs, TP, and TP-siRC@tHyNPs. (C) Tumor volume growth curves during the experiment (N = 4). (D) Weight of excised tumors in different group (N = 4). (E) Tumor growth inhibition rate in treatment groups (N = 4). (F) Survival curves of mice bearing PDX tumors under different treatments (N = 6). (G) H&E assay images of tumor sections in different group (scale bar, 50 μm). (H and I) TUNEL staining and cleaved caspase 3 expression in different groups (scale bars, 100 μm). (J) Ki67 immunolabeling of tumor tissue sections (scale bar, 100 μm). (K) CRT immunostaining of tumor sections in different groups (scale bar, 100 μm). Means ± SD, *P < 0.05; **P < 0.01; ***P < 0.001.

Similar articles

Cited by

References

    1. Long G. V., Swetter S. M., Menzies A. M., Gershenwald J. E., Scolyer R. A., Cutaneous melanoma. Lancet 402, 485–502 (2023). - PubMed
    1. Skudalski L., Waldman R., Kerr P. E., Grant-Kels J. M., Melanoma: An update on systemic therapies. J. Am. Acad. Dermatol. 86, 515–524 (2022). - PubMed
    1. Xiong K., Qi M., Stoeger T., Zhang J., Chen S., The role of tumor-associated macrophages and soluble mediators in pulmonary metastatic melanoma. Front. Immunol. 13, 1000927 (2022). - PMC - PubMed
    1. Zhang K. S., Pelleg T., Campbell S., Rubio C., Loschner A. L., Ie S., Pulmonary metastatic melanoma: Current state of diagnostic imaging and treatments. Melanoma Manag. 8, MMT58 (2021). - PMC - PubMed
    1. Rashid S., Shaughnessy M., Tsao H., Melanoma classification and management in the era of molecular medicine. Dermatol. Clin. 41, 49–63 (2023). - PubMed

MeSH terms