. 2025 Jul 25;11(30):eads7544.
doi: 10.1126/sciadv.ads7544. Epub 2025 Jul 23.

Genetic foundations of interindividual neurophysiological variability

Affiliations

Genetic foundations of interindividual neurophysiological variability

Jason da Silva Castanheira et al. Sci Adv. .

Abstract

Neurophysiological brain activity shapes cognitive functions and individual traits. Here, we investigated the extent to which individual neurophysiological properties are genetically determined and how these adult traits align with cortical gene expression patterns across development. Using task-free magnetoencephalography in monozygotic and dizygotic twins, as well as unrelated individuals, we found that neurophysiological traits were significantly more similar between monozygotic twins, indicating a genetic influence, although individual-specific variability remained predominant. These heritable brain dynamics were mainly associated with genes involved in neurotransmission, expressed along a topographical gradient that mirrors psychological functions, including attention, planning, and emotional processes. Furthermore, the cortical expression patterns of genes associated with individual differentiation aligned most strongly with gene expression profiles observed during adulthood in previously published longitudinal datasets. These findings underscore a persistent genetic influence on neurophysiological activity, supporting individual cognitive and behavioral variability.


Figures

Fig. 1.
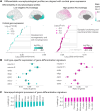
Fig. 1.. Neurophysiological profiling.
(A) Color-coded similarity matrix showing self-similarity (diagonal elements) and between-participant similarity (off-diagonal elements) of neurophysiological profiles, computed across three independent recordings. Similarity was assessed using cross-correlation coefficients. A participant was considered correctly differentiated if their own profiles were more similar across sessions than to profiles from others. Twin sibling matching was assessed using the same similarity statistics. (B) Bar plots showing twin pair matching accuracies across broadband (1 to 150 Hz) and standard electrophysiological frequency bands (delta (1 to 4 Hz), theta (4 to 8 Hz), alpha (8 to 13 Hz), beta (13 to 30 Hz), gamma (30 to 50 Hz), and high gamma (50 to 150 Hz). Orange bars represent MZ and DZ twin matching accuracies; purple bars represent matching accuracies between randomly paired unrelated individuals. Gray bars represent chance-level matching based on mock neurophysiological profiles derived from empty-room MEG recordings. Error bars denote 95% CIs. (C) Cortical maps of heritability estimates for neurophysiological traits, computed using Falconer’s equation, illustrating the spatial distribution of genetic contributions across the cortex. Legend: b-fp1: first brain-fingerprint; b-fp2: second brain-fingerprint; MZ: monozygotic twins; DZ: dizygotic twins.
Fig. 2.
Fig. 2.. Analysis pipeline and outcomes of gene-differentiation PLS analysis.
(A) Two data matrices were submitted to a PLS and GO analysis: (i) the first data matrix gathered the most salient traits for neurophysiological profiling and (ii) the second data matrix contained scores of gene expression across the regions of the Schaefer 200 cortical atlas (79). The PLS analysis resulted in latent components capturing the modes of largest covariance between these variables. Using the elements with top loadings, we performed a GO analysis to determine whether the contributing genes were enriched for specific molecular processes. (B) Left panel shows the PLS latent components with pink dots, ordered by decreasing effect size. Statistical significance was determined with 1000 permutations of the observed data, with spatial autocorrelation correction applied, highlighting only the first latent component. The right panel shows the related cortical topographies of gene-expression and ICC scores derived by projecting this first latent component onto the observed data. Positive gene brain scores positively covary with ICC brain scores and negatively covary with negative ICC brain scores. (C) We trained the PLS model using 75% of the cortical regions, selected based on their proximity in Euclidean distance to a randomly selected seed (dark purple regions), and tested the relationship between gene expression and ICC scores on the rest of the data. The median out-of-sample relationship observed was r = 0.64 (Pspin = 0.002).
Fig. 3.
Fig. 3.. Associations between neurophysiological traits, cortical gene expression, and neuropsychological processes.
(A) Gene-differentiation PLS analysis. The top panel shows neurophysiological brain score patterns for positive and negative loadings, indicating which cortical parcels align positively and negatively with the observed covariance pattern. The bottom panel presents the results of the GO analysis. Each point represents an enriched biological process within the corresponding gene set. The size of each point denotes the associated P value, while color intensity reflects the P value after spatial autocorrelation correction (Pspin). For clarity, related terms have been grouped together using horizontal bars. (B) Cell-type deconvolution analysis illustrating the proportion of genes (both positive and negative) preferentially expressed in seven distinct cell types based on prior single-cell and single-nucleus RNA sequencing studies (–41, 52). The significance of these ratios was assessed via permutation testing (P < 0.05). Points represent observed ratios, while box plots show the distribution of permuted gene set ratios. Key: “neuron I” refers to inhibitory neurons, “neuron E” to excitatory neurons, “endo” to endothelial cells, “oligo” to oligodendrocytes, “OPC” to oligodendrocyte precursor cells, “micro” to microglia, and “astro” to astrocytes. (C) Gene-neuropsychological processes PLS analysis. This panel illustrates the top 10 psychological terms that most significantly contribute negatively (cyan) and positively (pink) to the latent component identified in the gene-neuropsychological processes PLS analysis. The bar graphs display the loadings of neuropsychological terms. CIs were computed via bootstrapping and are not necessarily symmetric. Positively weighted terms positively covary with neurophysiological profiling and the positively weighted gene set. a.u., arbitrary unit.
Fig. 4.
Fig. 4.. Strengthening of the gene-differentiation signature across development.
The left panel illustrates the progressive increase in gene-differentiation scores across developmental stages (prenatal through adulthood) for 12 brain regions based on the BrainSpan data (49). A higher gene-differentiation score indicates greater similarity between the gene expression pattern at a given developmental stage and the gene-differentiation signature identified in adult neurophysiological profiles (see Fig. 3). The solid black line with gray shading indicates the trajectory of gene scores derived from random permutations of gene expression data. The right panel shows histograms of permuted slopes for each cortical region; vertical lines represent the empirical slopes, and asterisks denote regions where the gene-differentiation signature significantly strengthens across development (*PFDR < 0.05). Note that this analysis compares adult neurophysiological profiles with a longitudinal dataset of cortical gene expression. It therefore does not assume longitudinal changes in neurophysiological profiles, but rather assesses whether these adult profiles align with age-related changes in gene expression patterns.

Update of

Similar articles

References

    1. Finn E. S., Shen X., Scheinost D., Rosenberg M. D., Huang J., Chun M. M., Papademetris X., Constable R. T., Functional connectome fingerprinting: identifying individuals using patterns of brain connectivity. Nat. Neurosci. 18, 1664–1671 (2015). - PMC - PubMed
    1. da Silva Castanheira J., Orozco Perez H. D., Misic B., Baillet S., Brief segments of neurophysiological activity enable individual differentiation. Nat. Commun. 12, 5713 (2021). - PMC - PubMed
    1. Amico E., Goñi J., The quest for identifiability in human functional connectomes. Sci. Rep. 8, 8254 (2018). - PMC - PubMed
    1. Kaufmann T., Alnæs D., Brandt C. L., Bettella F., Djurovic S., Andreassen O. A., Westlye L. T., Stability of the Brain Functional Connectome Fingerprint in Individuals With Schizophrenia. JAMA Psychiatry 75, 749–751 (2018). - PMC - PubMed
    1. Kaufmann T., Alnæs D., Doan N. T., Brandt C. L., Andreassen O. A., Westlye L. T., Delayed stabilization and individualization in connectome development are related to psychiatric disorders. Nat. Neurosci. 20, 513–515 (2017). - PubMed

Publication types

LinkOut - more resources