. 2025 Jul 25;11(30):eado2837.
doi: 10.1126/sciadv.ado2837. Epub 2025 Jul 23.

A nociceptive amygdala-striatal pathway modulating affective-motivational pain

Affiliations

A nociceptive amygdala-striatal pathway modulating affective-motivational pain

Jessica A Wojick et al. Sci Adv. .

Abstract

The basolateral amygdala (BLA) assigns valence to sensory stimuli, with a dedicated nociceptive ensemble encoding the negative valence of pain. However, the effects of chronic pain on the transcriptomic signatures and projection architecture of this BLA nociceptive ensemble are not well understood. Here, we show that optogenetic inhibition of the nociceptive BLA ensemble reduces affective-motivational behaviors in chronic neuropathic pain. Single-nucleus RNA sequencing revealed peripheral injury-induced changes in genetic pathways involved in axonal and presynaptic organization in nociceptive BLA neurons. Next, we identified a previously uncharacterized nociceptive hotspot in the nucleus accumbens shell that is innervated by BLA nociceptive neurons. Axonal calcium imaging of BLA projections to the accumbens and chemogenetic inhibition of this pathway revealed pain-related transmission from the amygdala to the medial nucleus accumbens, facilitating both acute and chronic pain affective-motivational behaviors. Together, this work defines a critical nociceptive amygdala-striatal circuit underlying pain unpleasantness across pain states.


Figures

Fig. 1.
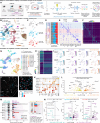
Fig. 1.. Inhibition of the BLAnoci ensemble reduces pain aversion in acute and chronic pain.
(A) nociTRAP protocol. (B) Representative images of neurons captured by nociTRAP tdTomato (red) and nociFOS (blue) with quantification of (C) nociTRAP (D) and nociFOS across the AP axis of the BLA, lateral amygdala (LA), and basal amygdala (BA). Scale bars, 250 μm. (E) Quantification of the colocalization of nociTRAP and nociFOS in neurons across the LA, BA, and BLA. (F) Representative images of nociTRAP colocalization with nociFOS (blue) versus home-cageFOS (gray) and quantification. Scale bars, 100 μm. (G) Colocalization of mateTRAP (purple) and nociFOS (blue). Scale bar, 100 μm. Quantification of colocalization of nociFOS with neurons captured by mateTRAP relative to nociTRAP. (H) Schematic and timeline of SNI. (I) Colocalization of uninjured nociTRAP (red) and light touch after SNI FOS (orange). Scale bar, 100 μm. Quantification of colocalization of light-touchFOS in animals than underwent SNI relative to a second acute nociceptive stimulus in uninjured mice [n = 4 nociTRAP nociFOS (2 male), n = 3 nociTRAP home-cageFOS (all female), n = 3 mateTRAP nociFOS (all male), and n = 3 nociTRAP SNI light-touchFOS (2 male)]. (J) Timeline and (K) schematic of experiment. (L) Histological confirmation of bilateral expression of stGtACR2 in the BLAnoci ensemble with bilateral fiber optics. Scale bars, 500 μm (left image) and 250 μm (right image). (M) Behavioral testing setup. (N) Optogenetic inhibition of the BLAnoci ensemble decreases the behavioral response to noxious stimuli compared to a prestimulus baseline [n = 23 StGtACR2 (12 male) and n = 20 tdTomato (10 male)]. (O) The increased response to innocuous and noxious stimuli was reduced during inhibition of the BLAnoci ensemble compared to prestimulus baselines [n = 11 StGtACR2 SNI (6 male), n = 10 tdTomato uninjured (5 male), and n = 10 tdTomato SNI (5 male)].
Fig. 2.
Fig. 2.. The BLAnoci ensemble is a functional subpopulation of Rspo2 BLA neurons.
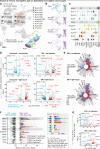
(A) Experimental design. Mice in three uninjured groups: no stimulus (n = 3), light touch (n = 3), or 55°C water droplet stimulation (n = 3) (all male mice, FISH done on mice of both sexes). (B) UMAP of all nuclei (n = 72,125) from uninjured mice (n = 9 total) captured by amygdala punches in 30 unique clusters. (C and D) Contribution of nuclei from stimulation groups to the total UMAP and cell types. (E and F) Dot plot and heatmap displaying a top gene differentiating the 30 cell clusters. (G) UMAP of amygdalar neuron nuclei (n = 51,775) showing 13 inhibitory (Gad1+ or Gad2+) and 10 BLA (Vglut1+) putative clusters. (H) Heatmap displaying top genes differentiating the 23 neural clusters. (I) Feature plots of genes for cell classes, published gene markers for valence/nociception in the BLA and CeA, and IEGs. (J) Representative 4× and 20× fluorescence images and quantification of FISH. Scale bar, 100 μm. (K) Violin plot displaying expression of genes identified in past BLA RNA sequencing, including the expression of Rspo2, by subcluster. (L) Volcano plot of 350 DEGs between Rspo2+ BLA clusters 0 and 4. Yellow dots indicate genes enriched in the BLA subcluster, and orange dots indicate genes enriched in the BLA4 subcluster. (M) IEG modular activity scores of 10 putative BLA clusters across stimulation conditions segregated by percentile thresholds. (N) Volcano plots of BLA clusters 0 and 4 displaying DEG upper stimulation condition enriched in the IEG+ or IEG− nuclei. Purple dots indicate genes only identified as differentially expressed within that condition, and gray dots indicate shared DEGs across multiple conditions.
Fig. 3.
Fig. 3.. Chronic pain imparts a unique transcriptomic signature on the BLA.
(A) UMAP of all neuronal nuclei (n = 73,512) from n = 12 mice across uninjured [no stimulus, n = 3; light touch, n = 3 (all male mice)] and chronic neuropathic pain (SNI) [no stimulus, n = 3; light touch, n = 3 (all male mice)] conditions identifying 36 unique cell type clusters. (B) Feature plots of genes for cell classes and for Rspo2. (C) Violin plot displaying the expression of genes identified in past BLA RNA sequencing, including the expression of Rspo2, by subcluster. (D) Volcano plots of all BLA subclusters combined displaying DEGs unique across injury and stimulation conditions. Red dots indicate genes enriched under that condition, blue dots indicate genes enriched under all other conditions, and gray dots indicate shared DEGs across conditions. (E) Synaptic gene ontology analysis of DEGs from (D) up-regulated under SNI + no stimulus or SNI + light touch conditions indicating the cellular compartments these DEGs are associated with. (F) IEG modular activity scores of 10 putative BLA clusters across stimulation conditions. (G) Volcano plots of Rspo2+ BLA subclusters 0 and 4 displaying DEGs unique between IEG+ and IEG− nuclei in SNI. Red dots indicate genes enriched under that condition, blue dots indicate genes enriched under all other conditions, and gray dots indicate shared DEGs across multiple conditions.
Fig. 4.
Fig. 4.. The BLAnoci ensemble projects to a nociceptive hotspot in the dorsomedial NAcSh.
(A) Expression of GFP in the right BLAnoci ensemble. Scale bar, 100 μm. (B) BLAnoci ensemble axons with nociceptive tdTomato neurons. Scale bars, 200 μm. (C) Quantification of BLAnoci axon density by area and tdTomato in ipsilateral ROIs. a.u., arbitrary units. (D) nociTRAP captures a nociceptive hotspot in the dorsomedial NAcSh (NAcShnoci). Scale bars, 500 μm. (E) BLAnoci ensemble axons and NAcShnoci neurons throughout the AP axis of the NAc. Scale bar, 200 μm. (F) Quantification of tdTomato NAcSh neurons in the medial versus lateral shell. (G) Images (60×) of BLAnoci ensemble axons and NAcShnoci neurons. Scale bars, 50 μm. (H) Quantification of NAcShnoci neurons and BLAnoci ensemble axon density across the ipsilateral NAcSh. (I) Representative images of nociTRAP colocalization with nociFOS versus home-cageFOS. Scale bars, 100 μm. (J) Colocalization of mateTRAP and nociFOS. Scale bar, 100 μm. Colocalization of nociFOS with neurons captured by mateTRAP or nociTRAP. (K) Timeline of SNI. (L) Colocalization of uninjured nociTRAP and SNI light-touchFOS. Scale bar, 100 μm. Colocalization of SNI light-touchFOS versus a second acute nociceptive stimulus in uninjured mice [n = 4 nociTRAP nociFOS (2 male), n = 3 nociTRAP home-cageFOS (all female), n = 3 mateTRAP nociFOS (all male), and n = 3 nociTRAP SNI light-touchFOS (2 male)]. (M) Retrograde tracing and reactivation of afferents in the mNAcSh. (N) Timeline. (O) Representative images of the injection site in the mNAcSh and the BLA. Scale bars, 200 μm. (P) Quantification of nociceptive and non-nociceptive mNAcSh-projecting BLA cells. (Q) Colocalization of light-touchFOS in nociceptive and non-nociceptive mNAcSh-projecting BLA cells [n = 4 (1 male)].
Fig. 5.
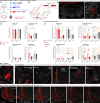
Fig. 5.. The BLA transmits nociceptive information to the dorsomedial NAcSh.
(A) AAV5-hSyn1-FLEX-axon-GCaMP6s in the BLA of Rspo2-Cre mice; expression of axon-GCaMP6s in the NAcSh with the optic fiber above the mNAcSh. Scale bars, 500 μm (left image) and 100 μm (right image). (B) BLA Rspo2 axon terminals in the NAcSh display significantly decreased Ca2+ activity in response to innocuous, noxious, and appetitive stimuli compared to prestimulus baselines. (C) Quantification of peak z-score of all stimuli. (D) Quantification of AUC (arbitrary units; calculated as AUC poststimulus (0 to 5 s) minus AUC prestimulus (−10 to −5 s)] of all stimuli [n = 7 (4 males); n = 6 for sucrose]. (E) AAV5-hSyn1-FLEX-axon-GCaMP6s in the BLAnoci ensemble of TRAP2 mice; expression of axon-GCaMP6s in the NAcSh with the optic fiber above the mNAcSh. Scale bars, 500 μm (left image) and 100 μm (right image). (F) BLAnoci ensemble axon terminals in the NAcSh display significantly increased Ca2+ activity in response to noxious stimuli compared to prestimulus baselines and decreased activity in response to innocuous and appetitive stimuli. (G) Quantification of peak z-score of Ca2+ responses to stimuli. (H) Quantification of AUC of all stimuli [n = 13 (6 males)]. (I) Timeline and stimulation and recording paradigm. (J) BLAnoci ensemble axons in the NAcSh display increased Ca2+ activity in response to a light touch compared to uninjured mice. (K) The AUC was elevated in response to a light touch in mice with SNI compared to uninjured mice. (L) Quantification of peak z-score of the Ca2+ responses to stimuli between uninjured and SNI mice [n = 13 uninjured (6 males) and n = 5 SNI (2 males)]. The peak z-score is calculated over 10 s poststimulus.
Fig. 6.
Fig. 6.. Inhibition of the mNAcSh-to-BLAnoci ensemble reduces affective-motivational behaviors during acute and chronic pain.
(A) Schematic for the intersectional viral approach to express the inhibitory chemogenetic protein hM4D(Gi) or control OScarlet in BLAnoci neurons that project to the mNAcSh. (B) Timeline of chemogenetic experiment and behavioral paradigms. (C) Histological confirmation of the bilateral expression of hM4D(Gi)-mCherry in the BLAnoci-to-mNAcSh ensemble. Scale bars, 1 mm (left image, 4×) and 250 μm (right image, 20×). (D) Chemogenetic inhibition of the mNAcSh-projecting BLAnoci ensemble decreases the behavioral response to noxious thermal stimuli compared to a prestimulus baseline [n = 16 hM4 (9 males) and n = 20 OScarlet (12 males)]. (E) The post-SNI increased response to thermal stimuli was reduced during inhibition of the mNAcSh-projecting BLAnoci ensemble compared to prestimulus baselines [n = 9 hM4 uninjured (5 male), n = 7 hM4 SNI (4 male), n = 10 OScarlet uninjured (6 male), and n = 10 OScarlet SNI (6 male)]. (F and G) Representative 20× images of the BLAnoci ensemble cells that project to the mNAcSh and their axon collaterals throughout the brain (scale bar, 100 μm). (H) Pattern of axon projections from the BLAnoci ensemble cells that project to the mNAcSh throughout the AP axis of the NAc. Scale bar, 100 μm.

Update of

References

    1. Kimmey B. A., McCall N. M., Wooldridge L. M., Satterthwaite T. D., Corder G., Engaging endogenous opioid circuits in pain affective processes. J. Neurosci. Res. 100, 66–98 (2022). - PMC - PubMed
    1. Kuner R., Kuner T., Cellular circuits in the brain and their modulation in acute and chronic pain. Physiol. Rev. 101, 213–258 (2021). - PubMed
    1. Pignatelli M., Beyeler A., Valence coding in amygdala circuits. Curr. Opin. Behav. Sci. 26, 97–106 (2019). - PMC - PubMed
    1. Gore F., Schwartz E. C., Brangers B. C., Aladi S., Stujenske J. M., Likhtik E., Russo M. J., Gordon J. A., Salzman C. D., Axel R., Neural representations of unconditioned stimuli in basolateral amygdala mediate innate and learned responses. Cell 162, 134–145 (2015). - PMC - PubMed
    1. Janak P. H., Tye K. M., From circuits to behaviour in the amygdala. Nature 517, 284–292 (2015). - PMC - PubMed

LinkOut - more resources