. 2025 Aug 1;24(8):4191-4201.
doi: 10.1021/acs.jproteome.5c00300. Epub 2025 Jul 23.

NMR Spectroscopy-Based Lipoprotein and Glycoprotein Biomarkers Differentiate Acute and Chronic Inflammation in Diverse Healthy and Disease Population Cohorts

Affiliations

NMR Spectroscopy-Based Lipoprotein and Glycoprotein Biomarkers Differentiate Acute and Chronic Inflammation in Diverse Healthy and Disease Population Cohorts

Samantha Lodge et al. J Proteome Res. .

Abstract

Understanding the distribution and variation in NMR-based inflammatory markers is crucial to the evaluation of their clinical utility in disease prognosis and diagnosis. We applied high-resolution 1H NMR spectroscopy of blood plasma and serum to measure the acute phase reactive glycoprotein signals (GlycA and GlycB) and the subregions of the lipoprotein-based Supramolecular Phospholipid Composite signals (SPC1, SPC2, and SPC3) in a large multicohort population study. A total of 5702 samples were studied to determine the signal variations in a range of chronic and acute inflammatory conditions. We found that while GlycA and GlycB were increased in inflammation, the SPC regions behaved independently of Glyc signals, with SPC2 and SPC3 being reduced in chronic inflammation in comparison to healthy controls (p-value SPC2 = 2.9 × 10⁻¹⁰, p-value SPC3 = 2.2 × 10⁻³) and SPC1 (p-value = 0.29) being unchanged. SPC1 was decreased in acute inflammation, indicating a link to the immune response (p-value = 2.5 × 10⁻¹¹). These findings confirm the independent biological relevance of all three SPC subregions and contraindicate the use of aggregate SPC values as general inflammatory markers.

Keywords: C-reactive protein; NMR spectroscopy; SARS-CoV-2; SPC; Supramolecular Phospholipid Composite signals; acute inflammation; blood plasma metabolic phenotyping; cardiovascular disease risk; chronic inflammation; diabetes; glycoproteins; inflammation.


Figures

1
1
(A) Overview of the blood lipoproteins. Very low-density lipoprotein (VLDL), intermediate-density lipoprotein (IDL), and the two subfractions visible using the DIRE experiment, the low-density lipoprotein (LDL) and high-density lipoprotein (HDL). (B) The segments of the composite SPC peak, SPC1, SPC2, and SPC3 in the DIRE NMR spectrum with the associated lipoprotein subfractions from which the peak arises from shown.
2
2
(A) PCA scores plot and the associated loadings of the variables of healthy individuals (blue square), those with chronic inflammation (cardiovascular disease, yellow circle), and individuals with acute inflammation (acute SARS-CoV-2 infection, red triangle). (B) Box plots of healthy individuals (blue), those with chronic inflammation (yellow), and those with acute inflammation (red) for SPC1, SPC2, SPC3, GlycA, GlycB, and SPC/Glyc. Adjusted p-values of all plots can be found inTables S4–S9.
3
3
(A) Box plot of healthy individuals (blue), those with chronic inflammation (yellow), and those with acute inflammation (red) for the SPC3/SPC2 ratio.
4
4
Box plots showing changes in the inflammatory markers for the healthy participants and nonhealthy participants of the population cohort at time point 1 and time point 2, collected 5 years apart, showing no significant difference between the time points and across the age ranges. Criteria of healthy participants of the BHAS study have been described previously. ,
5
5
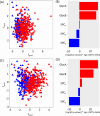
(A) OPLS-DA scores of healthy participants (blue) and patients with cardiovascular disease (red) (R2X = 0.48, AUROC = 0.77, CV-AUROC = 0.77) and (B) −log10 p-values of the inflammatory markers. Red is higher in cardiovascular disease, and blue is lower in cardiovascular disease in comparison to healthy individuals. (C) OPLS-DA of healthy participants (blue) and patients with type 2 diabetes (red) (R2X = 0.46, AUROC = 0.84, CV-AUROC = 0.83) and (D) −log10 p-values of the inflammatory markers. All p-values for both models can be found in Tables S10 and S11.

Similar articles

References

    1. Romano M.. Inflammation resolution: does the bone marrow have a say? Am. J. Hematol. 2008;83:435–436. doi: 10.1002/ajh.21202. - DOI - PubMed
    1. Wright T. M.. Cytokines in acute and chronic inflammation. Front Biosci. 1997;2:d12–d26. doi: 10.2741/A171. - DOI - PubMed
    1. Stotts C., Corrales-Medina V. F., Rayner K. J.. Pneumonia-Induced Inflammation, Resolution and Cardiovascular Disease: Causes Consequences and Clinical Opportunities. Circ. Res. 2023;132:751–774. doi: 10.1161/CIRCRESAHA.122.321636. - DOI - PubMed
    1. Lodge S., Nitschke P., Kimhofer T., Coudert J. D., Begum S., Bong S.-H., Richards T., Edgar D., Raby E., Spraul M., Schaefer H., Lindon J. C., Loo R. L., Holmes E., Nicholson J. K.. NMR Spectroscopic Windows on the Systemic Effects of SARS-CoV-2 Infection on Plasma Lipoproteins and Metabolites in Relation to Circulating Cytokines. J. Proteome Res. 2021;20:1382–1396. doi: 10.1021/acs.jproteome.0c00876. - DOI - PubMed
    1. Ward P. A.. The Acute Inflammatory Response and Its Regulation. Arch Surg. 1999;134:666–669. doi: 10.1001/archsurg.134.6.666. - DOI - PubMed