Integration of label-free surface enhanced Raman spectroscopy (SERS) of extracellular vesicles (EVs) with Raman tagged labels to enhance ovarian cancer diagnostics
- PMID: 40700940
- PMCID: PMC12352489
- DOI: 10.1016/j.bios.2025.117800
Integration of label-free surface enhanced Raman spectroscopy (SERS) of extracellular vesicles (EVs) with Raman tagged labels to enhance ovarian cancer diagnostics
Abstract
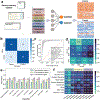
We report a proof-of-concept diagnostic strategy that integrates multiplexed Raman-tagged antibody labeling with label-free surface-enhanced Raman spectroscopy (SERS) and machine learning (ML) to improve the detection of ovarian cancer via extracellular vesicles (EVs). EVs were isolated from patient plasma using size-exclusion chromatography and labeled with polyyne-based Raman tags targeting three ovarian cancer biomarkers: CA-125, HE4, and CA-19-9. Labeled and unlabeled EVs were deposited onto SERS-active substrates, and spectra were collected using a custom confocal Raman microscope. Incorporating the tag-derived signal into SERS analysis enhanced interpretability and added molecular specificity. We evaluated classification performance using various ML models applied to spectral datasets from a cohort of ovarian cancer patients and healthy controls. Combined use of the Raman tag and label-free regions improved classification accuracy compared to either modality alone. Notably, support vector machine (SVM) achieved over 95 % accuracy, sensitivity, and specificity. Compared to ELISA, our SERS platform demonstrated improved sensitivity in detecting EV-associated biomarkers from small sample volumes. This approach addresses a key limitation of SERS-based diagnostics by linking spectral features to known biomarkers, offering improved transparency and performance in ML-enabled liquid biopsy.
Keywords: Artificial intelligence; Biomarkers; Exosomes; Liquid biopsy.
Copyright © 2025 The Authors. Published by Elsevier B.V. All rights reserved.
Conflict of interest statement
Declaration of competing interest The authors declare the following financial interests/personal relationships which may be considered as potential competing interests: Randy P. Carney reports financial support was provided byHave we correctly interpreted the following funding source(s) and country names you cited in your article: National Institutes of Health, United States; NIH, United States; University of California, United States? National Institutes of Health. If there are other authors, they declare that they have no known competing financial interests or personal relationships that could have appeared to influence the work reported in this paper.
Figures


Similar articles
-
Lung cancer diagnosis through extracellular vesicle analysis using label-free surface-enhanced Raman spectroscopy coupled with machine learning.Theranostics. 2025 Jun 23;15(15):7545-7566. doi: 10.7150/thno.110178. eCollection 2025. Theranostics. 2025. PMID: 40756369 Free PMC article.
-
Blood biomarkers for the non-invasive diagnosis of endometriosis.Cochrane Database Syst Rev. 2016 May 1;2016(5):CD012179. doi: 10.1002/14651858.CD012179. Cochrane Database Syst Rev. 2016. PMID: 27132058 Free PMC article.
-
Machine learning (ML)-assisted surface-enhanced raman spectroscopy (SERS) technologies for sustainable health.Adv Colloid Interface Sci. 2025 Oct;344:103594. doi: 10.1016/j.cis.2025.103594. Epub 2025 Jul 5. Adv Colloid Interface Sci. 2025. PMID: 40664096 Review.
-
Evaluating the effectiveness of pre-operative diagnosis of ovarian cancer using minimally invasive liquid biopsies by combining serum human epididymis protein 4 and cell-free DNA in patients with an ovarian mass.Int J Gynecol Cancer. 2024 May 6;34(5):713-721. doi: 10.1136/ijgc-2023-005073. Int J Gynecol Cancer. 2024. PMID: 38388177
-
Mid-level data fusion of pleural effusion SERS spectra and serum CEA levels using machine learning algorithms for precise lung cancer detection.Nanoscale. 2025 Jul 10;17(27):16349-16360. doi: 10.1039/d5nr01405k. Nanoscale. 2025. PMID: 40548612
References
-
- American Cancer Society, 2022. Cancer Treatment & Survivorship Facts & Figures (2022-2024). American Cancer Society, Atlanta.
-
- Bedard PL, Hyman DM, Davids MS, Siu LL, 2020. Lancet 395, 1078–1088. - PubMed
-
- Chang C-W, Hsu Y-N, Yang Y-H, Chang S-W, Zhang J-W, Yungsung Chen Q, Hung S-T, Cheng K-H, Hsieh S, Wang H-Y, Sun Y, Kuo K-K, Tu L-W, 2024. IEEE Sens. J 24, 31754–31762.
MeSH terms
Substances
Grants and funding
LinkOut - more resources
Full Text Sources
Medical
Research Materials
Miscellaneous

