. 2025 Jul 22;15(7):e093858.
doi: 10.1136/bmjopen-2024-093858.

Geographical patterns of tuberculosis notification rates and their association with socioeconomic factors in Nepal: a spatial cross-sectional study (2020-2023)

Affiliations

Geographical patterns of tuberculosis notification rates and their association with socioeconomic factors in Nepal: a spatial cross-sectional study (2020-2023)

Roshan Kumar Mahato et al. BMJ Open. .

Abstract

Objectives: To identify the patterns of tuberculosis (TB) notification rates and examine their relationship with social and economic determinants in Nepal between 2020 and 2023.

Design: Cross-sectional study.

Setting: Nepal.

Participants: All TB cases across all ages.

Primary outcome: Prevalence of TB cases.

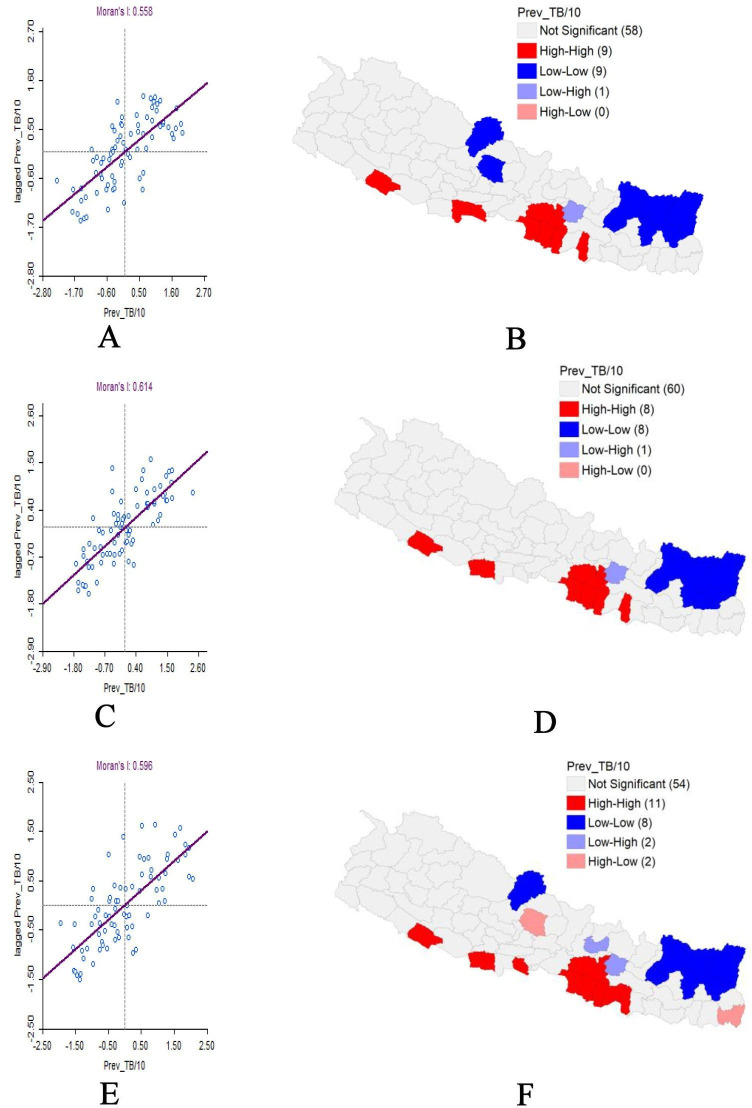
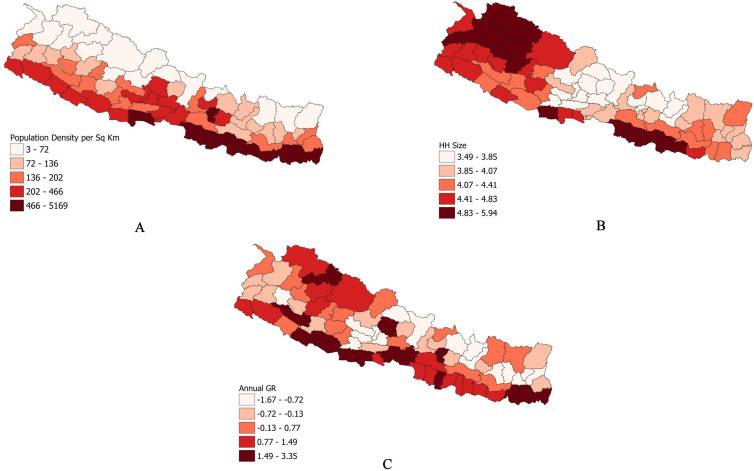
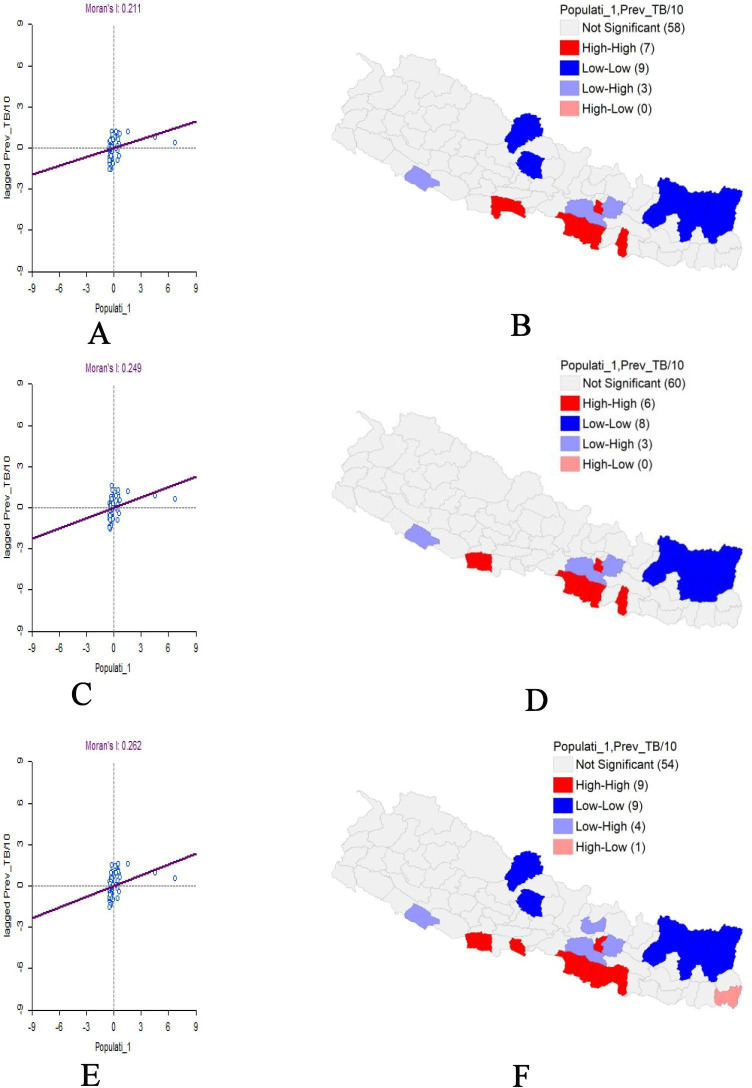
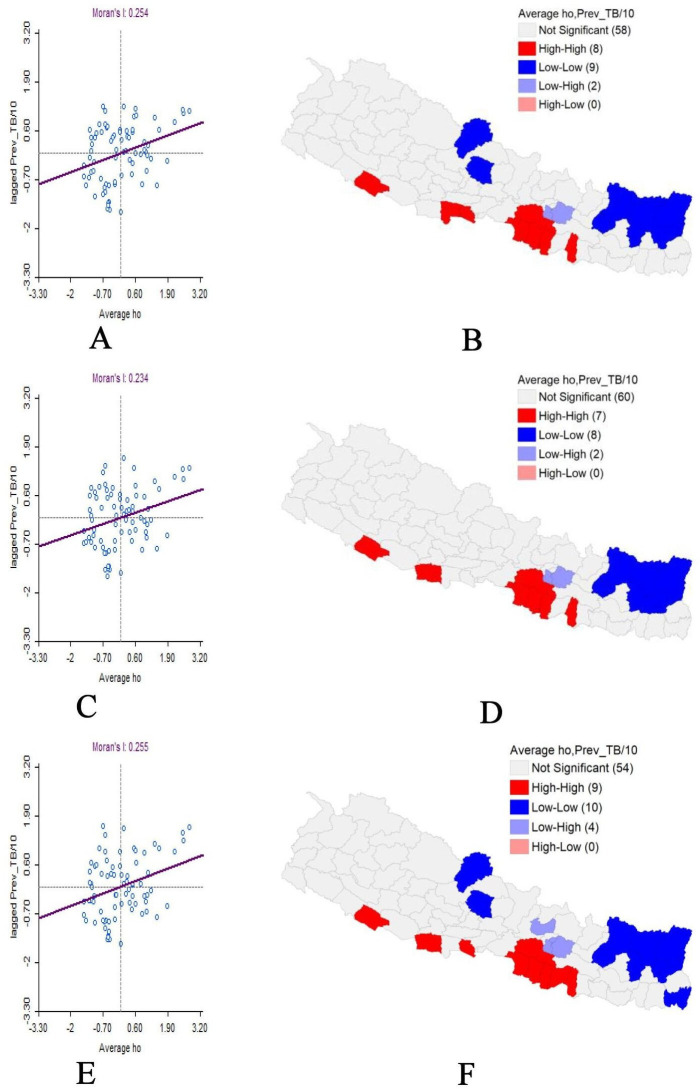
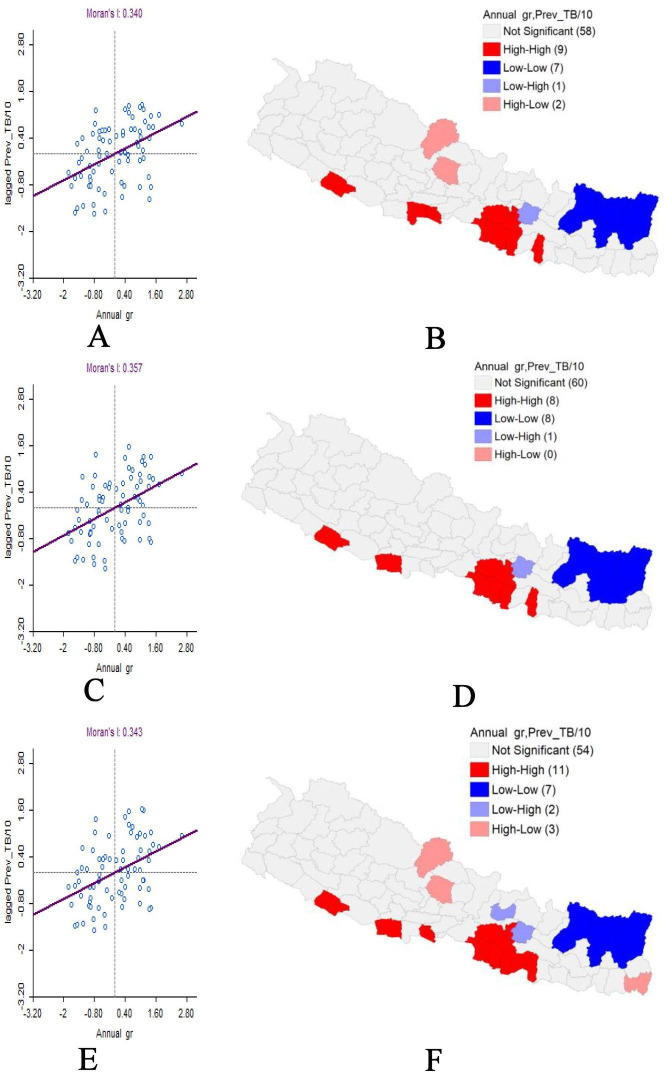
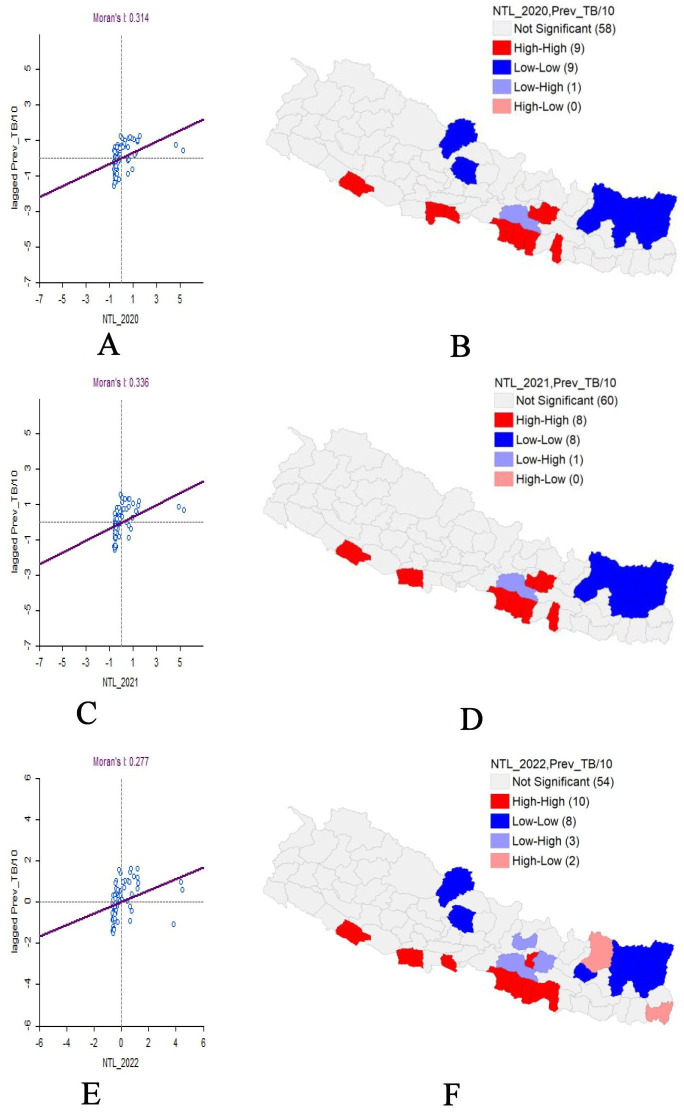
Methods: This cross-sectional spatial analysis used the data set of the National Tuberculosis Control Centre, Nepal, covering the Fiscal Year (FY) 2020-2021 to 2022-2023. Moran's I and Local Indicators of Spatial Association were employed to detect the spatial autocorrelation between the prevalence of TB and associated social and demographic factors.

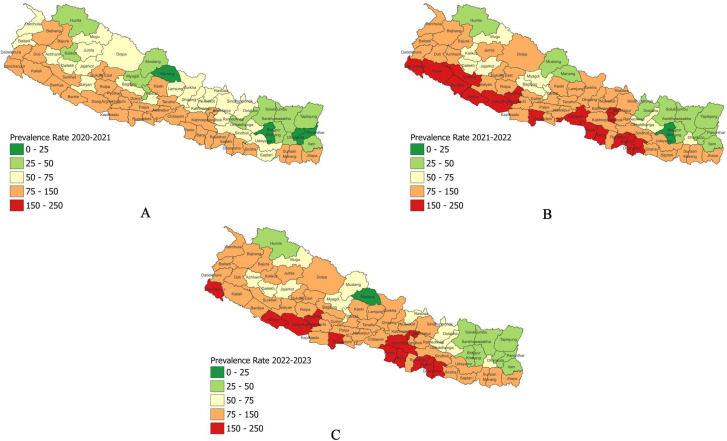
Results: The overall prevalence rate for TB in FY 2020-2021 was 98.08 per 100 000 population. This increased to 129.82 per 100 000 population in FY 2021-2022, followed by a slight decrease to 128.39 per 100 000 population in FY 2022-2023. The highest TB prevalence was observed in Kathmandu, with 146 cases per 100 000 population in 2020-2021, and in Dang district, the rate decreased from 215-191 per 100 000 population. We investigated the spatial patterns of TB prevalence and highlighted the geographic areas in each district in Nepal from 2021 to 2023 with Moran's I of 0.558, 0.614 and 0.596, respectively. The consistent identification of High-High clusters in specific districts like Banke, Kapilbastu and Parsa across all 3 years periods highlighted persistent high-risk areas for TB transmission in Nepal.

Conclusions: This study emphasised the strong spatial associations and the complex, diverse aspects of TB transmission shaped by demographic and socioeconomic factors. Our results highlighted the need for tailored public health approaches that account for specific social determinants to address TB effectively.

Keywords: Epidemiology; Nepal; Tuberculosis.


Conflict of interest statement

Competing interests: None declared.

Figures

Figure 1
Figure 1. Annual prevalence rate of tuberculosis (TB) in Nepal FY 2020–2023: (A) Prevalence rate of TB in FY 2020–2021, (B) Prevalence rate of TB in FY 2021–2022 and (C) Prevalence rate of TB in FY 2022–2023.
Figure 2
Figure 2. Univariate analysis of prevalence of tuberculosis (TB) cases in Nepal FY 2020–2023: (A) Moran’s I scatter plot of TB case in FY 2020–2021, (B) Local indicators of spatial association (LISA) map of TB case in FY 2020–2021, (C) Moran’s I scatter plot of TB case in FY 2021–2022, (D) LISA map of TB case in FY 2021–2022, (E) Moran’s I scatter plot of TB case in FY 2022–2023 and (F) LISA map of TB case in FY 2022–2023.
Figure 3
Figure 3. (A) Population density, (B) Average household size and (C) Annual growth rate. GR, growth rate; HH, household.
Figure 4
Figure 4. Annual trend of night-time light (NTL): (A) NTL density in 2020–2021, (B) NTL density in 2021–2022 and (C) NTL density in 2022–2023.
Figure 5
Figure 5. Bivariate analysis of population density and tuberculosis (TB) prevalence FY 2020–2023: (A) Moran’s I scatter plot of population density and TB case in FY 2020–2021, (B) Local indicators of spatial association (LISA) map of population density and TB case in FY 2020–2021, (C) Moran’s I scatter plot of population density and TB case in FY 2021–2022, (D) LISA map of population density and TB case in FY 2021–2022, (E) Moran’s I scatter plot of population density and TB case in FY 2022–2023 and (F) LISA map of population density and TB case in FY 2022–2023.
Figure 6
Figure 6. Bivariate analysis of average household size and tuberculosis (TB) prevalence FY 2020–2023: (A) Moran’s I scatter plot of average household size and TB case in FY 2020–2021, (B) Local indicators of spatial association (LISA) map of average household size and TB case in FY 2020–2021, (C) Moran’s I scatter plot of average household size and TB case in FY 2021–2022, (D) LISA map of average household size and TB case in FY 2021–2022, (E) Moran’s I scatter plot of average household size and TB case in FY 2022–2023 and (F) LISA map of average household size and TB case in FY 2022–2023.
Figure 7
Figure 7. Bivariate analysis of annual growth rate and tuberculosis (TB) prevalence FY 2020–2023: (A) Moran’s I scatter plot of annual growth rate and TB case in FY 2020–2021, (B) Local indicators of spatial association (LISA) map of annual growth rate and TB case in FY 2020–2021, (C) Moran’s I scatter plot of annual growth rate and TB case in FY 2021–2022, (D) LISA map of annual growth rate and TB case in FY 2021–2022, (E) Moran’s I scatter plot of annual growth rate and TB case in FY 2022–2023 and (F) LISA map of annual growth rate and TB case in FY 2022–2023.
Figure 8
Figure 8. Bivariate analysis of night-time light (NTL) and tuberculosis (TB) prevalence in FY 2020–2023: (A) Moran’s I scatter plot of NTL density and TB case in FY 2020–2021, (B) Local indicators of spatial association (LISA) map of NTL density and TB case in FY 2020–2021, (C) Moran’s I scatter plot of NTL density and TB case in FY 2021–2022, (D) LISA map of NTL density and TB case in FY 2021–2022, (E) Moran’s I scatter plot of NTL density and TB case in FY 2022–2023 and (F) LISA map of NTL density and TB case in FY 2022–2023.

Similar articles

References

    1. Sagavkar SR, Devkar SR. Tuberculosis: A Review. Asian Jour Pharmac Rese. 2018;8:191. doi: 10.5958/2231-5691.2018.00033.3. - DOI
    1. Floyd K, Glaziou P, Zumla A, et al. The global tuberculosis epidemic and progress in care, prevention, and research: an overview in year 3 of the End TB era. Lancet Respir Med. 2018;6:299–314. doi: 10.1016/S2213-2600(18)30057-2. - DOI - PubMed
    1. WHO Global tuberculosis report 2023. 2023.
    1. World Bank Tuberculosis case detection rate (%, all forms) 2023. https://data.worldbank.org/indicator/SH.TBS.DTEC.ZS Available.
    1. World Health Organization Country overview, Nepal. 2024. https://data.who.int/countries/524 Available.

LinkOut - more resources