. 2025 Aug 6;147(31):28056-28072.
doi: 10.1021/jacs.5c07977. Epub 2025 Jul 23.

Crystallizing the Uncrystallizable: Insights from Extensive Screening of PROTACs

Affiliations

Crystallizing the Uncrystallizable: Insights from Extensive Screening of PROTACs

Martin A Screen et al. J Am Chem Soc. .

Abstract

PROTACs are new drug molecules in the beyond Rule of Five (bRo5) chemical space with extremely poor aqueous solubility and intrinsically poor crystallizability due to their structure, which comprises two distinct ligands covalently linked by a flexible linker. This makes PROTACs particularly challenging to understand from a solid-state preformulation perspective. While several X-ray structures have been reported of PROTACs in ternary complexes, to date no structures have been published of single component densely packed PROTACs, from which an understanding of PROTACs' intermolecular interactions, and therefore physical properties, can be developed. An extensive crystallization protocol was applied to grow single crystals of a cereblon-recruiting PROTAC "AZ1" resulting in structures of an anhydrous form and a nonstoichiometric p-xylene solvate using 3D electron diffraction and synchrotron X-ray crystallography, respectively. The lattice energies are dominated by dispersive interactions between AZ1 molecules despite the presence of multiple hydrogen-bond donors and acceptors and planar aromatic groups, and both structures are built on similar intermolecular interactions. Thermal and spectral characterization revealed another solvate form containing dichloromethane. Amorphous solids produced by mechanochemical grinding of anhydrous AZ1 crystals also differed in dissolution characteristics from an amorphous solid produced by desolvating the dichloromethane solvate crystals, indicating that AZ1 may demonstrate pseudo-polyamorphism. This study paves the way for solid form screening and understanding in pharmaceutical systems that are far bRo5.


Figures

1
1. PROTAC Compound “AZ1”
1
1
(a) XRPD patterns of AZ1mix, AZ1RRS and AZ1RRR as synthesized. (b) XRPD patterns of Form 1 (anhydrous), Form 2 (dichloromethane solvate) and Form 3 (p-xylene solvate). The powder pattern for Form 3 was simulated from SC-XRD data since there was not enough material to characterize by XRPD. (c) SEM image of Form 1 (AZ1RRS). (d) Optical microscope image of Form 2 (AZ1mix). (e) Diffractometer microscope image of Form 3.
2
2
Form 1 crystal structure. (a) Dimer interaction between AZ1 molecules involving a head-to-tail N9–H9···O1 interaction. (b–d) Views down crystallographic a, b and c axes respectively.
3
3
(a) CrysIn analysis of Form 1. The bar chart shows the percentage contribution of each pairwise interaction type to the total lattice energy. The line chart shows the cumulative lattice energy accounted for as pairwise interactions are summed together. The numbers above each bar chart are the dispersive ratios for each pairwise interaction, where a ratio of 1 indicates a fully dispersive interaction with no electrostatic contribution. (b–d) The three pairwise interactions that contribute the most to the Form 1 lattice energy by CrysIn analysis. From top to bottom: the AZ1 dimer interaction (d006); aliphatic stacking interactions along the b axis (d000/d001); aliphatic stacking interactions along the a axis (d009). The remaining six pairwise interactions are shown in SI Figure S5.
4
4
Crystal structure of AZ1 Form 3 with the disordered p-xylene solvent removed via the SQUEEZE algorithm. (a) The unit cell of Form 3 with a single hydrogen bond between the two AZ1 molecules, viewed down the b axis. (b) The view down the a axis. (c) The view down the c axis.
5
5
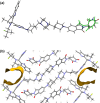
(a) Disorder in the CRBN ligand of AZ1 arising from the presence of both RRR- and RRS- diastereomers in an 88:12 ratio in the crystal structure of Form 3. The RRS- minor component is highlighted in green. (b) Solvent accessible voids in the crystal structure of AZ1 Form 3, depicted using Mercury.
6
6
(a) CrysIn analysis of Form 3. The bar chart shows the percentage contribution of each pairwise interaction type to the total lattice energy. The line chart shows the cumulative lattice energy accounted for as pairwise interactions are summed together. The numbers above each bar chart are the dispersive ratios for each pairwise interaction, where a ratio of 1 indicates a fully dispersive interaction with no electrostatic contribution. (b–d) The three pairwise interactions of AZ1 molecules that contribute the most to the lattice energy of the Form 3 crystal structure. These three dispersive interactions cumulatively account for 84% of the lattice energy. From top to bottom: AZ1 dimer interaction (d008); aliphatic stacking interactions along the b axis (d000/d001); aliphatic stacking interactions in the ac plane (d006/d007). The remaining three pairwise interactions are shown in SI Figure S7.
7
7
Comparison of AZ1 crystal conformations in Form 1 (full color) and Form 3 (green highlight). Only the major RRR- isomer component of the Form 3 crystal structure is shown. Only the RRS- isomer is present in Form 1.
8
8
Dependence of the (a) lattice energy (E latt) and (b) lattice energy per atom with the number of atoms of the crystallizing compound for the CSD-drugsNZ1,1 subset (gray), and AZ1 forms 1 and 3 structures reported in this work (orange).
9
9
FTIR spectra comparing AZ1 Form 1 and 2. There are differences in the peak breadth and wavenumber in the 1600–1750 and 3100–3500 cm–1 regions, suggesting differences in the type and/or degree of hydrogen-bonding.
10
10
FTIR spectra of AZ1 amorphized by grinding Form 1 in a ball mill (amorphous form A) or by desolvating Form 2 (amorphous form B).
11
11
Nonsink dissolution profiles over 2 h in fasted state simulated intestinal fluid (FaSSIF) at 37 °C, using a 10-fold nonsink condition relative to the crystalline solubility (Form 1). (a) Dissolution profiles of AZ1 Form 1 crystals, amorphous form A and amorphous form B, with all three samples prepared using AZ1mix. (b) Dissolution profiles of amorphous form A samples produced separately from AZ1mix, AZ1RRR and AZ1RRS as well as amorphous form B. AZ1mix and AZ1RRS were milled to produce amorphous form A while AZ1RRR was used as synthesized without milling. Average concentrations and error bars are shown for time-points acquired in triplicate for both plots.
12
12
SEM images of (a) AZ1MIX ball-milled, (b) AZ1RRS ball-milled, (c) AZ1RRR as synthesized and (d) desolvated Form 2. While the milled samples are very similar with most particles between 1–5 μm in length, AZ1RRR shows greater polydispersity with the presence of larger particles above 10 μm.

References

    1. Cruz-Cabeza A. J., Reutzel-Edens S. M., Bernstein J.. Facts and fictions about polymorphism. Chem. Soc. Rev. 2015;44:8619–8635. doi: 10.1039/C5CS00227C. - DOI - PubMed
    1. Brittain, H. G. Polymorphism in Pharmaceutical Solids; Dekker: New York, 1999; Vol. 95.
    1. Hancock B. C., Parks M.. What is the true solubility advantage for amorphous pharmaceuticals? Pharm. Res. 2000;17:397–404. doi: 10.1023/A:1007516718048. - DOI - PubMed
    1. Saifee M., Inamdar N., Dhamecha D. L., Rathi A. A.. Drug polymorphism: a review. Int. J. Health Res. 2010;2:291–306. doi: 10.4314/ijhr.v2i4.55423. - DOI
    1. Suresh K., Mehta T., Thakrar V., Sharma R. G.. Innovative Strategies in Generic Drug Development: The Role of Polymorph, Amorphous, Pseudopolymorph, and Cocrystal Solid Forms. Cryst. Growth Des. 2025;25:1282–1292. doi: 10.1021/acs.cgd.4c01558. - DOI

LinkOut - more resources