. 2025 Jul 23;16(1):553.
doi: 10.1038/s41419-025-07874-9.

H3K14 lactylation exacerbates neuronal ferroptosis by inhibiting calcium efflux following intracerebral hemorrhagic stroke

Affiliations

H3K14 lactylation exacerbates neuronal ferroptosis by inhibiting calcium efflux following intracerebral hemorrhagic stroke

Tingting Sun et al. Cell Death Dis. .

Abstract

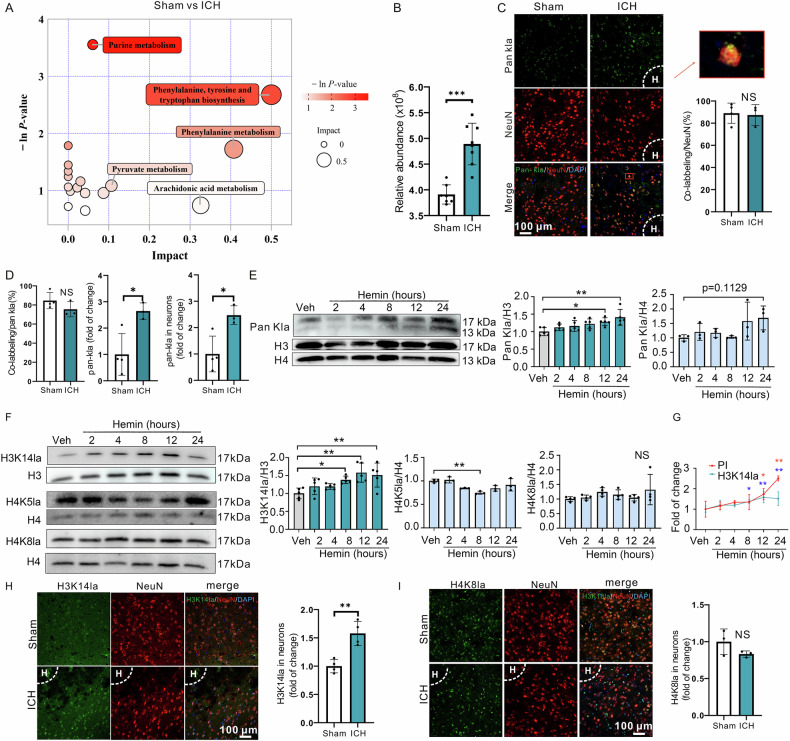
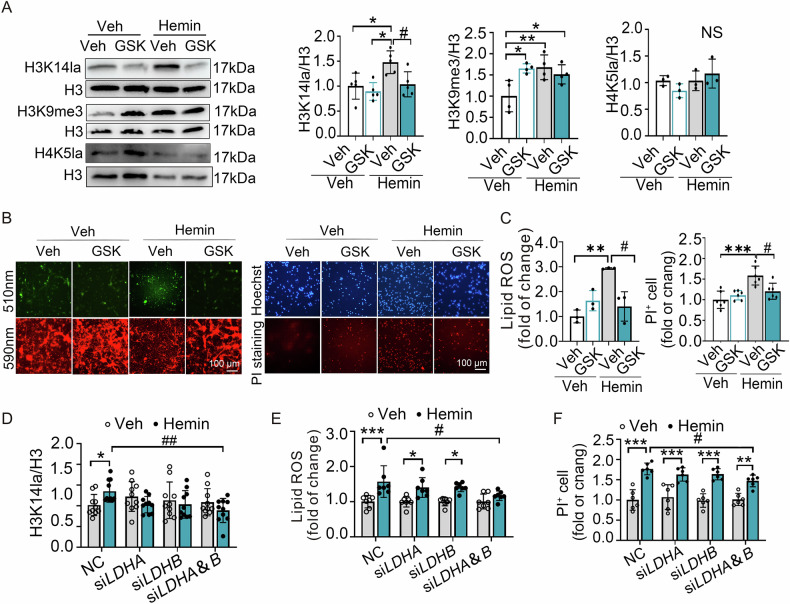
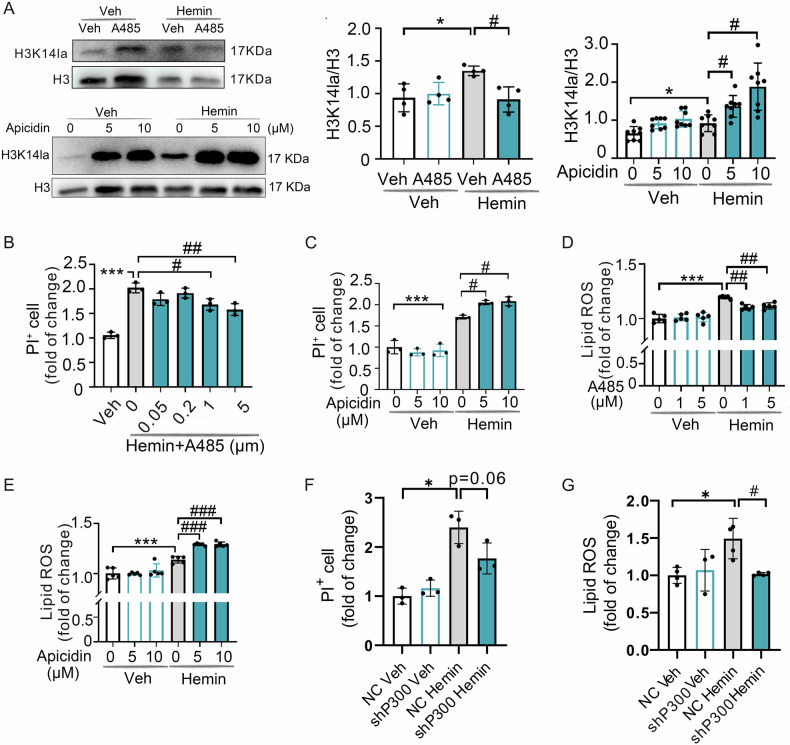
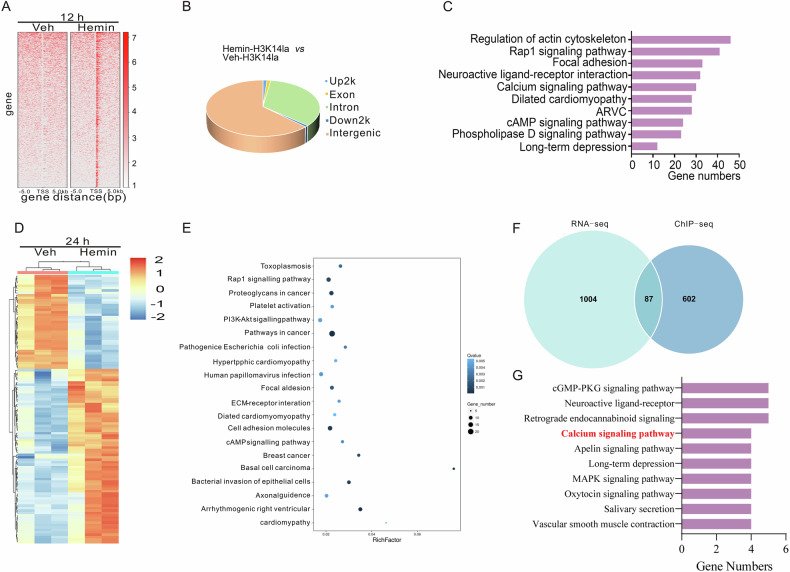
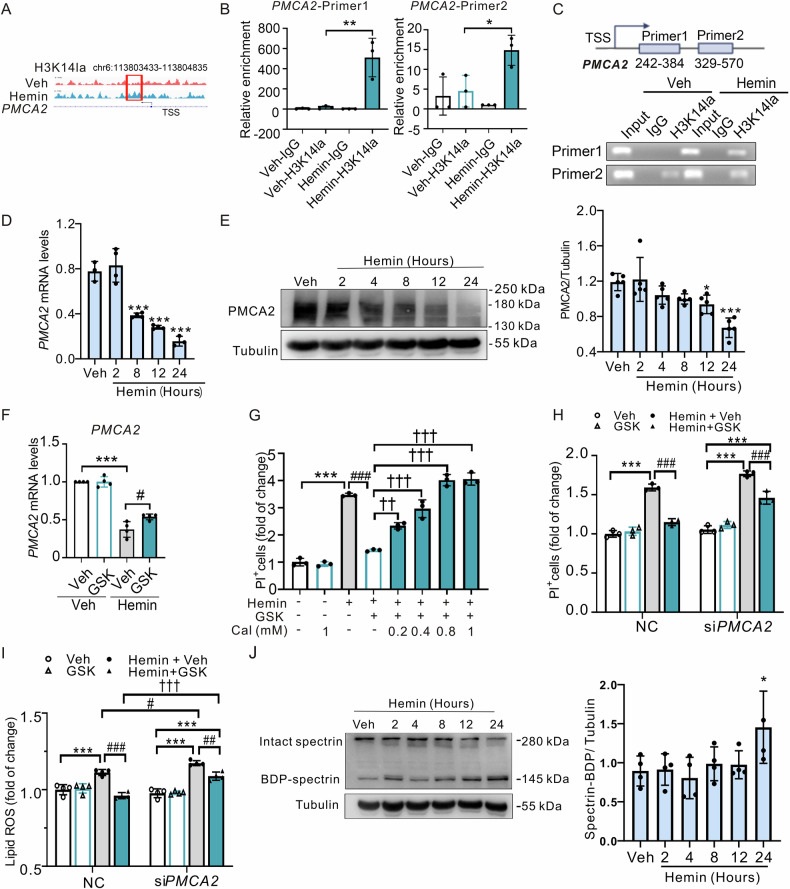
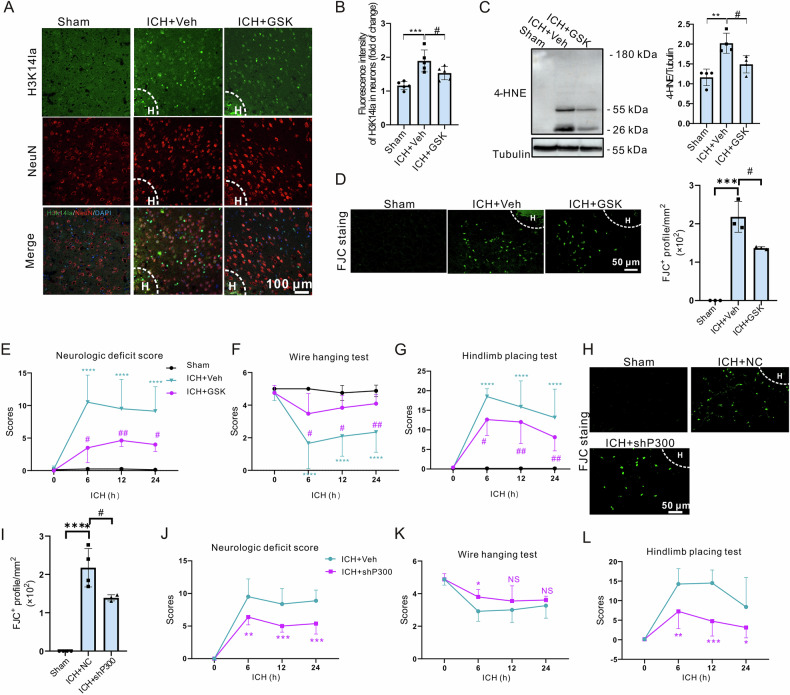
Inhibiting neuronal ferroptosis is essential for mitigating neural damage and enhancing recovery in central nervous system (CNS) disorders, including intracerebral hemorrhagic stroke (ICH). Lactate accumulation correlates with ICH severity, yet the role of lactate-derived histone lactylation, a novel epigenetic modification, in ferroptosis and its mechanisms is not fully understood. In this study, we aimed to investigate the role of histone lactylation on neuronal ferroptosis in ICH models, both in vitro and in vivo. We discovered elevated lactate and histone lactylation post-ICH in mice, with a significant increase in H3K14la during the early stages of ferroptosis in hemin-challenged primary cortical neurons. Pharmacological or genetic inhibition of H3K14la by targeting lactate dehydrogenase (LDH) enzyme activity effectively suppressed neuronal ferroptosis. We further identified p300/CBP and class I histone deacetylases (HDACs) as the key modifiers of H3K14la in this process. Through chromatin immunoprecipitation-sequencing and RNA-sequencing (RNA-seq) in hemin-treated neurons, we pinpointed the Ca2+-ATPase PMCA2 encoding gene as a direct downstream target of H3K14la. H3K14la/PMCA2 promoted ferroptosis by elevating intracellular calcium levels. In line with our in vitro findings, inhibiting H3K14la/PMCA2 reduced neuronal degeneration and improved functional outcomes in an ICH mouse model induced by intracranial injection of collagenase into the striatum. Taken together, our findings elucidate the role of histone lactylation and PMCA2 in neuronal ferroptosis and implicate that targeting histone lactylation could be a promising therapeutic strategy for ICH and related CNS diseases.


Conflict of interest statement

Competing interests: The authors declare no competing interests. Ethics approval and consent to participate: All animal experiments were approved by the Animal Care and Use Committee of Capital Medical University (AEEI-2020-164). All methods were performed in accordance with the relevant guidelines and regulations.

Figures

Fig. 1
Fig. 1. The levels of H3K14la were increased in ferroptotic neurons after ICH.
The untargeted metabolomics analysis was performed to characterize the metabolic changes in sham and ICH mice. The biology diagram shows the metabolic pathway in sham and ICH mice (A). The lactic acid content between the two groups is shown (B). (sham group: n = 7 mice; ICH group: n = 8 mice). C, D Immunostaining of pan Kla and NeuN was performed after ICH. “H” indicates hematoma. The representative images and quantifications are shown. (sham group: n = 4 mice; ICH group: n = 3 mice) E, F The levels of pan Kla, H3K14la, H4K5la and H4K8la were examined by Western blotting. (pan Kla: n = 5 cultures; H3K14la: n = 5 cultures; H4K5la: n = 3 cultures; H4K8la: n = 4 cultures). G The levels of H3K14la and PI staining in PCNs at different time points upon hemin or Veh treatment were compared. H, I Immunostaining of H3K14la, H4K8la and NeuN was performed after ICH. “H” indicates hematoma. (H3K14la: n = 4 mice; H4K8la: n = 3 mice) The representative images and quantifications are shown. Results are shown as (BF and HI) scatter plots (Mean ± SD) or (G) line graphs (Mean ± SD). Unpaired two-tailed Student’s t test (BD and HI) or one-way ANOVA followed by Dunnett’s multiple comparisons tests (EG) was used. *p < 0.05, **p < 0.01, ***p < 0.001vs Veh; NS, not significant.
Fig. 2
Fig. 2. Inhibition of LDH activity suppressed hemin-induced neuronal ferroptosis in vitro.
A After the indicated treatment of PCNs for 12 h, the levels of H3K14la, H3K9me3, and H4K5la were examined using Western blotting. H3 serves as a loading control. (H3K14la: n = 5 cultures; H3K9me3: n = 4 cultures; H4K5la: n = 3 cultures). BODIPY 581/591 C11 reagent was used to detect the changes of intracellular lipid ROS after 24 h treatment with 50 µM hemin and 50 µM GSK, and the cell death was detected by PI and Hoechst staining (B). The quantifications for cell death and the intracellular lipid ROS are shown (C). (lipid ROS: n = 3 cultures; PI: n = 6 cultures). D After LDHA and LDHB were silenced by siRNA, the expression of H3K14la was detected by Western blotting at 12 h after 50 µM hemin treatment in PCNs. n = 10 cultures. E After transfection with siRNA of LDHA and LDHB, the lipid ROS of 50 µM hemin-treated PCNs were detected at 24 h by BODIPY 581/ 591 C11 reagent. n = 7 cultures. F After transfection with siRNA of LDHA and LDHB, the cell viability of hemin-treated PCNs was detected at 24 h by PI and Hoechst staining. n = 6 cultures. Results are shown as scatter plots (Mean ± SD). One-way ANOVA followed by Tukey’s multiple comparison tests (A, C), or two-way ANOVA followed by Sidak (DF) multiple comparison tests was used. *p < 0.05, **p < 0.01, ***p < 0.001 vs Veh; #p < 0.05, ##p < 0.01 vs Hemin; NS not significant.
Fig. 3
Fig. 3. P300/CBP and class I HDAC regulated neuronal ferroptosis by affecting H3K14la levels in vitro.
A After hemin treatment of PCNs at 12 h, the expression of H3K14la was detected after 50 µM hemin treatment and combined administration with A485 or Apicidin (left side: n = 4 cultures; right side: n = 8 cultures). B, C The changes in cell death after 50 µM hemin and A485 or Apicidin combined treatment later 24 h were detected by PI and Hoechst staining (B: n = 3 cultures; C: n = 3 cultures). D, E BODIPY 581/ 591 C11 reagent was used to detect the changes of intracellular lipid ROS later at 24 h after treatment with 50 µM hemin and A485 or Apicidin. n = 5 cultures. F The cell death of PCNs transduced with the AAV-hSyn-EGFP-NC (NC) or AAV-hSyn-EGFP-shP300 (shP300) at 24 h after hemin treatment was detected by PI and Hoechst staining. n = 3 cultures. G BODIPY 581/591 C11 reagent was used to detect the changes of intracellular lipid ROS in PCNs transduced with AAV virus NC or shp300 at 24 h after hemin treatment. Results are shown as scatter plots (Mean ± SD). n = 3-4 cultures. One-way ANOVA followed by Tukey’s multiple comparisons tests was used. *p < 0.05, ***p < 0.001 vs Veh; #p < 0.05, ##p < 0.01, ###p < 0.001 vs Hemin.
Fig. 4
Fig. 4. Identification of the potential target genes of H3K14la regulating ferroptosis after hemin treatment in vitro.
A The binding density of H3K14la was visualized by deepTools: the heatmap presents different H3K14la binding peaks in N2A cells between Veh and hemin groups. B ChIP-Seq detected the genomic distribution of the H3K14la in the Veh and hemin-treated N2A cells at 12 h. C KEGG analyses of annotated targets of H3K14la modification in hemin treated group based on ChIP-Seq data. D The RNA-Seq results from 24 h in neurons treated with Hemin. E KEGG analysis of annotated targets based on the RNA-Seq data. F Venn diagram of RNA-Seq and ChIP-Seq. G KEGG analysis of annotated targets of H3K14la modification in hemin treated group based on ChIP-Seq data with RNA-Seq data.
Fig. 5
Fig. 5. H3K14la/PMCA2 axis promotes ferroptosis by intracellular Ca2+ in PCNs after hemin treatment in vitro.
A The peaks of target genes were analyzed by an integrative genomics viewer. The red and blue respectively indicate the peak regions of H3K14la on the target gene about Veh and hemin group. n = 3 cultures. B The enrichment of H3K14la in PMCA2 was detected by ChIP-PCR in Veh and hemin treatment groups in N2A cells. C Design location of primers and results of agarose gel electrophoresis. D mRNA levels of PMCA2 were detected by RT-PCR at indicated time points after 50 µM hemin treatment. n = 3-4 cultures. E The expression of PMCA2 was detected at indicated time points after 50 µM hemin treatment. n = 5 cultures. F mRNA levels of PMCA2 were detected by RT-PCR after 50 µM hemin with GSK treatment of PCNs at 12 h. GAPDH serves as the internal control. n = 4 cultures. G The changes in cell death after 50 µM hemin and Caloxin 2a1(Cal) combined treatment later 24 h were detected by PI and Hoechst staining. n = 3 cultures. H After transfection with siRNA of PMCA2, the changes in cell death after 50 µM hemin or/and GSK combined treatment later 24 h were detected by PI and Hoechst staining. n = 3 cultures. I After transfection with siRNA of PMCA2, the lipid ROS of 50 µM hemin-treated PCNs with combined treatment of GSK were detected at 24 h by BODIPY 581/ 591 C11 reagent. n = 4 cultures. J The expression of spectrin was detected at indicated time points after 50 µM hemin treatment. Tubulin serves as the loading control. n = 4 cultures. Results are shown as scatter plots (Mean ± SD). One-way ANOVA followed by Tukey’s multiple comparisons tests (B and FI), or Dunnett’s (D, E, J) multiple comparisons tests were used, *p < 0.05, **p < 0.01, ***p < 0.001 vs Veh; #p < 0.05; ##p < 0.01, ###p < 0.001 vs Hemin +Veh; ††p < 0.01, †††p < 0.001 vs Hemin + GSK.
Fig. 6
Fig. 6. Inhibition of H3K14la improved functional outcomes after ICH in mice.
Immunostaining of H3K14la and NeuN was performed at 24 h after ICH. “H” indicates hematoma. The representative images (A) and quantifications (B) are shown. n = 5 mice. C The expression of 4-HNE was measured at 24 h after ICH by western blot analysis. Tubulin serves as the loading control. n = 4 mice. D FJC staining was performed at 24 h after ICH. The representative images and quantification are shown. n = 4 mice. E–G 1 μl of 500 μM GSK or 10 mM Caloxin 2A1 was injected at 30 min after ICH. Neurological function and motor function were determined at indicated time points after ICH. n = 8 mice. FJC staining was performed at 24 h after ICH. The representative images (H) and quantification (I) are shown. n = 4 mice. J–L AAV virus of NC or shP300 virus was injected at 1 week before ICH and Neurological function and motor function were examined at indicated time points after ICH. Results are shown as scatter plots (Mean ± SD). n = 8 mice. One-way (BD and I) or two-way (EG and JL) ANOVA followed by Tukey’s multiple comparisons tests was performed, *p < 0.05, **p < 0.01, ***p < 0.001, ****p < 0.0001vs Sham; #p < 0.05 vs ICH + NC/Veh; NS, not significant.
Fig. 7
Fig. 7. PMCA2 was one downstream target of H3k14la after ICH in mice.
A mRNA levels of PMCA2 were detected by RT-PCR at 24 h after ICH. GAPDH serves as the internal control. n = 5 mice. B FJC staining was performed at 24 h after ICH. The representative images and quantification are shown. n = 5 mice. (C–E) 1 μl of 500 μM GSK or 10 mM Caloxin 2A1 was injected at 30 min after ICH. Neurological function and motor function were determined at indicated time points after ICH. n = 8 mice. Results are shown as scatter plots (Mean ± SD). One-way (A, B) or two-way (C-E) ANOVA followed by Tukey’s multiple comparisons tests was performed, **p < 0.01, ***p < 0.001, ****p < 0.0001 vs Sham; #p < 0.05, ##p < 0.01, ###p < 0.001vs ICH + Veh; †p < 0.05, ††p < 0.01, †††p < 0.001 vs ICH + GSK.

Similar articles

References

    1. Dixon SJ, Lemberg KM, Lamprecht MR, Skouta R, Zaitsev EM, Gleason CE, et al. Ferroptosis: an iron-dependent form of nonapoptotic cell death. Cell. 2012;149:1060–72. - PMC - PubMed
    1. Jiang X, Stockwell BR, Conrad M. Ferroptosis: mechanisms, biology and role in disease. Nat Rev Mol Cell Biol. 2021;22:266–82. - PMC - PubMed
    1. Bersuker K, Hendricks JM, Li Z, Magtanong L, Ford B, Tang PH, et al. The CoQ oxidoreductase FSP1 acts parallel to GPX4 to inhibit ferroptosis. Nature. 2019;575:688–92. - PMC - PubMed
    1. Stockwell BR, Friedmann Angeli JP, Bayir H, Bush AI, Conrad M, Dixon SJ, et al. Ferroptosis: a regulated cell death nexus linking metabolism, redox biology, and disease. Cell. 2017;171:273–85. - PMC - PubMed
    1. Lan T, Sun TT, Wei C, Cheng T, Yang F, Zhang J-N, et al. Epigenetic regulation of ferroptosis in central nervous system diseases. Mol Neurobiol. 2023;60:3584–99. - PubMed