. 2025 Jul 23;16(1):555.
doi: 10.1038/s41419-025-07884-7.

Proteasome inhibition overcomes resistance to targeted therapies in B-cell malignancy models and in an index patient

Affiliations

Proteasome inhibition overcomes resistance to targeted therapies in B-cell malignancy models and in an index patient

Johanne U Hermansen et al. Cell Death Dis. .

Abstract

Treatment of B-cell malignancies with the PI3K inhibitor (PI3Ki) idelalisib often results in high toxicity and resistance, with limited treatment alternatives for relapsed/refractory patients since idelalisib is recommended as a later or last line therapy. To investigate resistance mechanisms and identify alternative treatments, we studied functional phenotypes of idelalisib-resistant B-cell malignancy models. The idelalisib-resistant KARPAS1718 model remained sensitive to Bcl-2 inhibitors (Bcl-2i), whereas the resistant VL51 model showed reduced sensitivity compared to parental cells. Sensitivity correlated with phosphorylation and expression of the Bcl-2 family members Bcl-2 and Bim. Target addiction scoring revealed high dependence on the proteasome, and proteasome inhibitors (PI) were effective across models and in primary chronic lymphocytic leukemia (CLL) cells, independently of their PI3Ki- or Bcl-2i-sensitivities. PI treatment consistently upregulated Bim and Mcl-1, while Bcl-2 increased in KARPAS1718 and CLL cells. Bcl-2i plus PI combinations led to an additive effect in these models. A multi-refractory CLL patient in the IMPRESS-Norway trial (NCT04817956) treated with Bcl-2i plus PI showed initial clinical improvement but relapsed within four months. Treatment induced Bim and Mcl-1 upregulation and reduced cytotoxic CD8+ T-cell and CD56dim NK-cell populations. Our findings suggest that PIs may overcome resistance to targeted therapies, and warrant further studies to optimize clinical responses.


Conflict of interest statement

Competing interests: ÅH has received research support from AstraZeneca, BMS, EliLilly, GSK, Incyte, Novartis, Roche, Ultimovacs, the Norwegian Cancer Society, The regional health authorities in Norway. Have given talks and advise to pharma companies, and all honoraria are going to the hospital (Abbvie, AstraZeneca, BMS, EliLilly, Janssen, Medicover, Merck, Novartis, Pfizer, Roche, Sanofi, Takeda). ARM has had a consulting or advisory role for AstraZeneca, TG Therapeutics, AbbVie/Genentech, Pharmacyclics, Adaptive Biotechnologies, Johnson & Johnson, Acerta Pharma/AstraZeneca, Loxo/Lilly, Curio/Vaniam Group, Merck, Bristol Myers Squibb/Pfizer, PerView, DAVA Oncology, BMS, Genmab, AXIS Education, and PER; and has received research funding from Regeneron, TG Therapeutics, Sunesis Pharmaceuticals, Loxo, AbbVie/Genentech, Pharmacyclics, Adaptive Biotechnologies, Johnson & Johnson, Acerta Pharma/AstraZeneca, DTRM, Genmab, and Nurix. FB has received institutional research funds from ADC Therapeutics, Bayer AG, BeiGene, Floratek Pharma, Helsinn, HTG Molecular Diagnostics, Ideogen AG, Idorsia Pharmaceuticals Ltd., Immagene, ImmunoGen, Menarini Ricerche, Nordic Nanovector ASA, Oncternal Therapeutics, Spexis AG; consultancy fee from BIMINI Biotech, Floratek Pharma, Helsinn, Immagene, Menarini, Vrise Therapeutics; advisory board fees to institution from Novartis; expert statements provided to HTG Molecular Diagnostics; travel grants from Amgen, Astra Zeneca, iOnctura. GET has received research grants from Mundipharma and Alexion Pharmaceuticals, advisory board honoraria from Alexion Pharmaceuticals and Janssen-Cilag, and lecture honoraria from Novartis, Janssen-Cilag, Alexion Pharmaceuticals, and Mundipharma. SSS has received consulting fees from AstraZeneca, BeiGene and Janssen; and research support from BeiGene and TG Therapeutics. The other authors declare no competing financial interests.

Figures
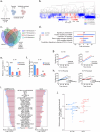
Fig. 1
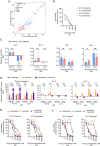
Fig. 1. Idelalisib-resistant B-cell malignancy models show distinct functional phenotypes.
a Illustration of the cell line models used in this study. KARPAS1718 and VL51 parental (blue) cells were made resistant to idelalisib (pink) by continuous exposure to a sub-lethal dose of idelalisib. The figure was made with biorender.com. b The heatmap shows the RNA counts of the 365 transcripts with differential transcription between parental and idelalisib-resistant cell lines. c The Venn diagram shows the overlapping transcripts between the KARPAS1718 and VL51 cell lines. The colored circles indicate up- or downregulated (arrows) transcripts in the resistant models, compared to their parental counterparts. d Pathway analysis of the cell lines showing the percentage of genes in a gene list belonging to the indicated pathway. A positive value of the fold enrichment indicates that the pathway is upregulated in the resistant cell line relative to the parental cell line. Blue bars refer to the KARPAS1718 model, while pink bars refer to the VL51 model. The asterisks show the FDR level of the fold enrichment of the pathways for each cell line and their variants calculated using Benjamini-Hochberg procedure. *p < 0.05, **p < 0.01, ***p < 0.001. e RNA was isolated from the indicated cell lines, followed by cDNA synthesis. qPCR analyses were performed with primers against IL-10 and β-actin. The barplot shows the relative quantity of IL-10 mRNA expression in the KARPAS1718 and VL51 parental (blue) and resistant (pink) models. The quantity of IL-10 (2-ΔΔCt) was calculated relative to the ΔCt value of KARPAS1718 parental IL-10 expression normalized to the reference gene β-actin. The plot shows the mean of three replicates, ±standard deviation (SD). Statistics were assessed with a 2-way ANOVA test with Bonferroni’s multiple comparison correction. **p < 0.01. f The supernatant from parental (blue) and resistant (pink) KARPAS1718 and VL51 cells were cleared by centrifugation and the quantities of human IL-10 (pg/mL) were measured using ELISA. The plot shows the mean of three replicates ±SD. Statistics were assessed with a 2-way ANOVA Bonferroni’s multiple comparison correction. ***p < 0.001, ****p < 0.0001. g Parental (blue) and idelalisib-resistant (pink) KARPAS1718 (left graph) and VL51 (right graph) cell lines were seeded in a 384-well plate with a start concentration of 5000 cells/well. The cell confluency was measured over time using an Incucyte S3 live cell imaging analyzer for 72 h. Growth curves of the cell lines show the confluence versus time. The plots show the mean of five replicates ±SD. Statistics were assessed with a two-way repeated measures ANOVA with Greisser-Greenhouse correction. ****p < 0.0001. h Parental (left graph) and idelalisib-resistant (right graph) KARPAS1718 lines were seeded in a corning 384-well plate with a start concentration of 5000 cells/well. The cells were either left untreated (control), or treated with 10 μg/ml anti-human CD210 (IL-10 R) antibody (black curve) or 20 ng/ml IL-10 (gray curve). The cell confluency was measured over time using an Incucyte S3 live cell imaging analyzer for 72 h. Growth curves of the cell lines show the confluence versus time. The plots show the mean of three replicates ±SD. Statistics were assessed with a two-way repeated measures ANOVA with Geidder-Greenhouse correction and Dunnett’s post hoc test to compare treatments to control. *p < 0.1, ****p < 0.0001. i Parental (blue) and idelalisib-resistant (pink) versions of KARPAS1718 (left graph) and VL51 (right graph) cell lines were fixed, permeabilized and stained with antibodies against 31 (phospho)proteins as indicated. The cells were analyzed with a BD LSR Fortessa flow cytometer, and the data were analyzed with Cytobank (https://cellmass.cytobank.org/cytobank). Raw median fluorescence intensity (MFI) data were noise corrected by subtracting the signal of an isotype control, and log10 transformed. The graphs show the mean (bars) and individual (circles) signals for n = 3–4 independent experiments for each cell line. j Experiments are described in (i). The relative protein fraction (resistant/parental cell line) was calculated for KARPAS1718 and VL51 cell lines. The graph shows the mean fraction from n = 3–4 experiments for n = 29 (phospho)proteins [STAT3 (pY705) and STAT6 (pY641) were excluded due to missing data]. Statistics were performed using an unpaired two-tailed parametric t-test comparing the parental and resistant cell lines. ns not significant, *p < 0.05, **p < 0.01.
Fig. 2
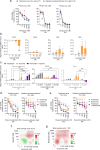
Fig. 2. Bcl-2 and Bim phosphorylation/expression correlates with sensitivity to Bcl-2i.
a Illustration of the drug library and therapeutic targets. b Parental (blue) and idelalisib-resistant (pink) KARPAS1718 (left graph) and VL51 (right graph) cell lines were treated with drugs or drug combinations at five different concentrations (1–10,000 nM) for 72 h. Cell viability was then assessed with the CellTiter-Glo luminescent cell viability assay. The graphs show the mean (bars) and individual (circles) drug sensitivity scores (DSS) to the different treatments for n = 2–3 independent experiments for each cell line. The scores were calculated based on the area under the dose-response curves. High score indicates high sensitivity to the treatment. c Parental (x-axis) and idelalisib-resistant (y-axis) KARPAS1718 (blue circles) and VL51 (pink squares) cell lines were treated with 87 drug combinations at five different concentrations (1–10,000 nM) for 72 h. Cell viability was then assessed with the CellTiter-Glo luminescent cell viability assay. The plot shows the mean DSS to the different treatments for n = 2–3 independent experiments for each cell line. The scores were calculated based on the area under the dose-response curves. Filled symbols indicate drug combinations that include the Bcl-2i sonrotoclax or venetoclax. d Pearson correlation analysis was performed on the mean (phospho)protein levels detected in Fig. 1h and the drug sensitivity score (DSS) to sonrotoclax (black circles) and venetoclax (white circles) described in (b), where the points indicate the parental and idelalisib-resistant versions of KARPAS1718 and VL51 cell lines. The p-values are shown for each correlation (two-tailed Pearson r). The error bars indicate standard deviation (SD).
Fig. 3
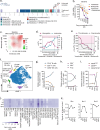
Fig. 3. Proteasome inhibitors are effective in idelalisib-resistant B-cell malignancy models.
a Target addiction score (TAS) of proteins in parental (x-axis) and idelalisib-resistant (y-axis) cell lines are shown. Each point indicates a single protein target. Targets with the highest addiction scores are annotated; B cell lymphoma 2 (BCL-2), histone deacetylase (HDAC), proteasome subunit beta (PMSB). b Parental (blue) and idelalisib-resistant (pink) versions of KARPAS1718 and VL51 cell lines were treated with ixazomib at five different concentrations (1–10,000 nM) for 72 h. Cell viability was then assessed with the CellTiter-Glo luminescent cell viability assay. The graph shows the mean cell viability for n = 1–3 experiments ±SD. ns not significant with a 2-way repeated measures ANOVA and Bonferroni’s multiple comparison correction. c Parental (blue) and idelalisib-resistant (pink) versions of KARPAS1718 and VL51 cell lines were treated with 50 nM ixazomib for 24 h. The cells were then fixed, barcoded, and permeabilized, before staining with antibodies against the indicated intracellular proteins. The cells were analyzed with a BD LSR Fortessa flow cytometer, and the data were analyzed with Cytobank (https://cellmass.cytobank.org/cytobank). The signal is shown as noise corrected median fluorescence intensity (MFI) relative to the DMSO control which was set to zero (mean ± SD, n = 3). Statistics were performed with a 2-way ANOVA Bonferroni’s multiple comparison correction. ns; not significant, *p < 0.05, **p < 0.01. d The indicated cell lines were treated with 50 nM venetoclax, 50 nM ixazomib, or 50 nM venetoclax + ixazomib for 24 h and further processed as described in (c). The bars show mean with standard deviation (SD) of n = 3 experiments. Statistics were performed with a 2-way ANOVA Bonferroni’s multiple comparison correction. ns; not significant, *p < 0.05, **p < 0.01, ***p < 0.001, ****p < 0.0001. e Parental (left) and idelalisib-resistant (right) versions of the KARPAS1718 cell lines were treated with venetoclax (gray), ixazomib (orange), or the combination (purple) at five different concentrations (1–10,000 nM) for 24 h in triplicates. Cell viability was then assessed with the CellTiter-Glo luminescent cell viability assay. The graphs show the mean cell viability ± SD, n = 3. Statistics were performed with a 2-way ANOVA and Bonferroni’s multiple comparison correction when comparing single treatment to combination treatment and indicated for the comparison with venetoclax in gray and for ixazomib in orange. ns not significant, *p < 0.05, ***p < 0.001, ****p < 0.0001. f Parental (left) and idelalisib-resistant (right) versions of the VL51 cell lines were treated with venetoclax, ixazomib, or the combination at five different concentrations (1–10,000 nM) for 24 h as described in (e). The graphs show the mean cell viability ±SD, n = 3. Statistics were performed with a 2-way ANOVA and Bonferroni’s multiple comparison correction when comparing single treatment to combination treatment and indicated for the comparison with venetoclax in gray and for ixazomib in orange. ns not significant, *p < 0.05, ***p < 0.001, ****p < 0.0001.
Fig. 4
Fig. 4. Proteasome inhibitors are effective in idelalisib-resistant primary CLL cells.
a Peripheral blood mononuclear cells (PBMCs) from treatment naïve (n = 7) or idelalisib-resistant/intolerant (n = 8) chronic lymphocytic leukemia (CLL) patients were co-cultured with APRIL/BAFF/CD40L fibroblasts for 24 h to prevent spontaneous apoptosis of the CLL cells. The CLL cells were then separated from the fibroblast layer and treated with venetoclax (left), ixazomib (middle) or bortezomib (right) at five different concentrations (1–10,000 nM) for 72 h. Cell viability was assessed with the CellTiter-Glo luminescent cell viability assay. The cell viability was normalized to negative (0.1% DMSO) and positive (100 μM benzethonium chloride) controls. The graphs show the mean viability, and the error bars indicate standard deviation (SD). ns not significant, **p < 0.01 with a 2-way ANOVA and Bonferroni’s multiple comparison correction. b Freshly thawed PBMCs from treatment naïve (n = 4) CLL patients were treated with 0.1% DMSO or 1, 10, 25 or 50 nM ixazomib for 24 h. The cells were stained with a fixable viability stain, fixed, barcoded, and stained with anti-CD3 and anti-CD19 surface markers prior to permeabilization. The cells were then stained with antibodies against the indicated intracellular proteins. The samples were analyzed with a BD LSR Fortessa flow cytometer, and the data were analyzed with Cytobank (https://cellmass.cytobank.org/cytobank). The signal is shown for as noise corrected median fluorescence intensity (MFI) relative to the DMSO control which was set to zero (mean ± SD, n = 3) for CD3CD19+ CLL cells. Statistics were performed with a one-way ANOVA test and Bonferroni corrected for multiple comparisons against the DMSO control. *p < 0.05, ***p < 0.001. c Experiment as described in (b), and the cells were treated with 0.1% DMSO or venetoclax, ixazomib or venetoclax + ixazomib at four different concentrations (1–50 nM) for 24 h. The graphs show the noise corrected median fluorescence intensity (MFI) signal relative to the DMSO control which was set to zero (mean ± SD, n = 3) for CD3CD19+ CLL cells. Statistics were performed with a 2-way ANOVA test with Bonferroni correction for multiple comparisons. *p < 0.05, **p < 0.01, ***p < 0.001, ****p < 0.0001. d PBMCs from n = 4 treatment naïve CLL patients (left panel) and from n = 3 idelalisib-resistant/intolerant CLL patients (right panel) were co-cultured with APRIL/BAFF/CD40L fibroblasts for 24 h to prevent spontaneous apoptosis of the CLL cells. The cells were then separated from the fibroblast layer and treated with 0.1% DMSO or venetoclax (gray), ixazomib (orange) or venetoclax + ixazomib (purple) at five different concentrations (1–10,000 nM) for 24 h in triplicates. Cell viability was assessed with the CellTiter-Glo luminescent cell viability assay. The cell viability was normalized to the negative (0.1% DMSO) control. The graphs show the mean viability of triplicates, and the error bars indicate standard deviation (SD). Statistics were performed with a 2-way ANOVA with Bonferroni correction when comparing single treatment to combination treatment and indicated for the comparison with venetoclax in gray and ixazomib in orange. ns; not significant, **p < 0.01, ***p < 0.001, ****p < 0.0001. e Experiments were performed as described in (d), but with bortezomib instead of ixazomib. f The data from experiment described in d were used in the DECREASE machine learning model (https://decrease.fimm.fi/) for predicting the full drug combination dose-response matrix, and further analyzed in SynergyFinder (https://synergyfinder.fimm.fi/) for scoring the synergy of the drug combination ixazomib and venetoclax. Average Bliss synergy score of the full matrix is indicated. g As described in (f), but with data from the experiments performed in (e).
Fig. 5
Fig. 5. Proteasome inhibitors are effective in a multi-resistant CLL index patient.
a Timeline illustrating the treatment history of the CLL patient. Baseline (B), week 8 (W8), week 16 (W16) and off-study (OFS) indicates the time-points when blood samples were collected from the patient. FCR fludarabine, cyclophosphamide, rituximab, EPOCH etoposide, prednisolone, vincristine, cyclophosphamide, doxorubicin. The figure was created with BioRender.com. b Peripheral blood mononuclear cells (PBMCs) from the baseline sample were co-cultured with APRIL/BAFF/CD40L fibroblasts for 24 h to prevent spontaneous apoptosis of the CLL cells. The cells were then separated from the fibroblast layer and treated with venetoclax (gray), bortezomib (orange), or venetoclax + bortezomib (purple) at five different concentrations (1–10,000 nM) for 24 h. Cell viability was assessed with the CellTiter-Glo luminescent cell viability assay and normalized to negative (0.1% DMSO) control. The graph shows the mean viability of triplicates, and the error bars indicate standard deviation (SD). Statistics were performed with a 2-way ANOVA with Bonferroni’s multiple comparison correction when comparing single treatment to combination treatment and indicated for the comparison with venetoclax in gray and for ixazomib in orange. ns not significant, *p < 0.05, ****p < 0.0001. c Data from experiment described in (b) were used in DECREASE (https://decrease.fimm.fi/) for predicting the full drug combination dose-response matrix, and further analyzed in SynergyFinder (https://synergyfinder.fimm.fi/) for scoring the synergy of the drug combination. Average Bliss synergy of the full matrix is indicated. d Hemoglobin and leukocyte counts of the CLL patient over time (in weeks) since start of venetoclax + ibrutinib + bortezomib treatment. Normal reference values are indicated with the filled areas in red and blue, respectively. e Thrombocyte and granulocyte counts of the CLL patient over time (in weeks) since start of venetoclax + ibrutinib + bortezomib treatment. Normal reference values are indicated with the filled areas in red and gray, respectively. f PBMCs collected at baseline, w8, w16 and off-study were fixed, barcoded, stained with surface markers, then permeabilized and stained with antibodies against intracellular (phospho)proteins. The samples were analyzed using a Cytek 5 L Aurora instrument, and the data were analyzed with Cytobank (https://cellmass.cytobank.org/cytobank). All live cells from the sample collected at baseline were visualized in a two-dimensional t-SNE (t-distributed stochastic Neighbour Embedding) plot generated based on the expression of the indicated surface markers. g Data from the experiment described in (f) were used to plot the relative population of CD19+ CLL cells (blue), CD3+ T-cells (orange) and CD56+ NK cells (gray) as percent of total live cells. h Data from the experiment described in (f) were used to plot the proportion of CD8+ (purple), CD4+ (green) and T regulatory cells (red) as percent of CD3+ cells. i Data from the experiment described in (f) were used to plot the proportion of NK subsets; CD56bright (brown), CD56dim (pink), CD56+CD16+ (gray) cells as percent of all CD3- CD56+ cells. j Data from the experiment described in (f). Signals from CD3CD19+ cells were selected for 31 (phospho)proteins as indicated. The raw median fluorescence intensity (MFI) data were noise corrected by subtracting the signal of an isotype control and normalized against an internal control. The heatmap was created using ClustVis (https://biit.cs.us.ee/clustvis). k Selected data for Bim, Mcl-1 and Bcl-2 as described in (j).

Similar articles

References

    1. Skånland SS, Okkenhaug K, Davids MS. PI3K inhibitors in hematology: when one door closes…. Clin Cancer Res. 2024;30:3667–75. - PMC - PubMed
    1. Richardson NC, Kasamon Y, Pazdur R, Gormley N. The saga of PI3K inhibitors in haematological malignancies: survival is the ultimate safety endpoint. Lancet Oncol. 2022;23:563–6. - PubMed
    1. Skånland SS, Tjønnfjord GE. Determining drug dose in the era of targeted therapies: playing it (un)safe?. Blood Cancer J. 2022;12:123. - PMC - PubMed
    1. Eichhorst B, Ghia P, Niemann CU, Kater AP, Gregor M, Hallek M, et al. ESMO Clinical Practice Guideline interim update on new targeted therapies in the first-line and at relapse of chronic lymphocytic leukaemia. Ann Oncol J Eur Soc Med Oncol. 2024;35:762–8. - PubMed
    1. Aronson JH, Skånland SS, Roeker LE, Thompson MC, Mato AR. Approach to a patient with “double refractory” chronic lymphocytic leukemia: “Double, double toil and trouble” (Shakespeare). Am J Hematol. 2022;97:S19–25. - PubMed

MeSH terms

LinkOut - more resources