. 2025 Jul 23;16(1):6794.
doi: 10.1038/s41467-025-61826-7.

Macrophage-T cell interactions promote SLAMF1 expression for enhanced TB defense

Affiliations

Macrophage-T cell interactions promote SLAMF1 expression for enhanced TB defense

G V R Krishna Prasad et al. Nat Commun. .

Abstract

CD4+ T cells are crucial for protective immunity to intracellular pathogens. In addition to secreting cytokines, CD4+ T cells promote control of Mycobacterium tuberculosis infection through cognate interactions with macrophages, but the mechanism has been unclear. Here, we show that SLAMF1/CD150 is highly and uniquely induced in macrophages by antigen-specific interactions with CD4+ T cells. In macrophages, SLAMF1 enhances the generation of reactive oxygen species and restricts Mtb replication. Mtb-infection of mice promotes SLAMF1 expression specifically on infected macrophages, not uninfected bystanders. SLAMF1 expression depends on adaptive immunity and also autophagy. Moreover, Slamf1-/- mice have higher Mtb burden and more rapid disease progression than wild type mice. Using Slamf1fl/fl conditional knock-out mice, we show that in vivo Slamf1 is specifically required in macrophages to restrict mycobacterial growth and limit IL-1β production. In macaques, macrophage SLAMFI expression also correlates with T cell responses and protection. Combined, these data demonstrate that SLAMF1 is a marker of macrophage-T cells interactions, and it promotes protection against Mtb.


Conflict of interest statement

Competing interests: The authors declare no competing interests.

Figures

Fig. 1
Fig. 1. Antigen-specific CD4+ T cells shape macrophage gene expression and drive Slamf1 expression on infected cells.
A Graphical representation of experimental design. B PCA plot of RNAseq expression based on 12000 genes with the greatest variance. CF Volcano plots of Gene set 1 (C), Gene set 2 (D), Gene set 3 (E), and Gene set 4 (F). Data points correspond to all of the DE genes with fold-change > 2 and FDR ≤ 0.1. P values are adjusted for multiple testing following the Benjamini-Hochberg procedure. (CE) A subset of the top fifteen most highly upregulated genes are shown in red. A subset of IFN-regulated genes is shown in purple. F Selected genes are shown in red. G SLAMF1 normalized read counts from infected, bystander, and uninfected macrophages co-cultured with or without T cells, as indicated. (UI) Uninfected; (Inf) Infected; (Bys) Bystander. Data are presented as mean values ± SD. Each data point is a biological replicate. P values from Brown Forsythe and Welch ANOVA test with Dunnett T3 multiple comparison test. H Heat map of 25 genes that were significantly DE (FDR < 0.1) in the generalized linear model with ‘T cell x infection status’ interaction term and also upregulated by Mtb infection and CD4+ T cells. log2FC for the respective comparisons (A-D) is indicated. Empty, white boxes indicate no significant difference. I, J Slamf1 expression values in BAL macrophages from scRNAseq scaled gene expression. Data is represented as heat maps, with each line representing expression from a single macrophage. BAL were obtained from NHPs that were unvaccinated (Unvac) or vaccinated with BCG by aerosol (AE), high dose intradermal (IDhigh), low dose intradermal (IDlow), or intravenous routes (IV) as described. BALs were obtained 13 weeks (I) and 25 weeks post-vaccination (J) and either unstimulated or stimulated with PPD prior to scRNAseq, as indicated. FDR comparing the IV vaccinated group to all other groups combined is shown. ns- not significant. A Created in BioRender. Philips, J. (https://BioRender.com/x9c1725). CF Elements created in BioRender. Philips, J. (https://BioRender.com/we24srw). Source data are provided as a Source Data file.
Fig. 2
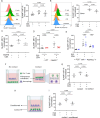
Fig. 2. SLAMF1 expression is induced in macrophages that present antigen to CD4+ T cells.
AI SLAMF1 expression was assessed by flow cytometry in BMDMs treated with IFN-γ, followed by infection with Mtb (A), treatment with P25 peptide (B, D, E, G, I), or ESAT-6 peptide (C), and subsequent co-culture for 24hrs with CD4+ T cells specific for P25 (A, B, D, E, G, I) or ESAT-6 (C). A, B Offset histograms show SLAMF1 fluorescence and corresponding SLAMF1 expression graphs. Data in the offset histograms are normalized to mode. AG, I SLAMF1 MFI is expressed as the percent increase relative to IFN-γ-treated cells (without infection, peptide, or T cells). A n = 7 biological replicates; (B, C) n = 5 biological replicates from 3–5 independent experiments; AC P values from matched one-way ANOVA with Holm-Sidak’s multiple comparison test. D SLAMF1 expression was compared in WT and MhcII−/− BMDMs. n = 7 biological replicates from 4 independent experiments. P value from Two-way ANOVA. E SLAMF1 expression in BMDMs after co-culture with WT or Ifng−/− P25 TcR Tg CD4+ T cells. n = 7 biological replicates from 4 independent experiments. P value from Two-way ANOVA. F BMDMs were grown in transwells in the indicated configuration, treated with P25 peptide, and co-cultured with CD4+ T cells and analyzed by flow cytometry. F, G Macrophages that contacted CD4+ T cells were compared to cells that did not make physical contact. n = 5 biological replicates from 5 independent experiments. P value from matched one-way ANOVA with Holm-Sidak’s multiple comparison test. H, I Macrophages that contacted CD4+ T cells were compared to macrophages grown in the same well without contact (conditioned). n = 5 biological replicates from 4 independent experiments, P value from matched one-way ANOVA with Holm-Sidak’s multiple comparison test. (AE, G, I) Data are presented as mean values ± SEM. F, H Created in BioRender. Philips, J. (https://BioRender.com/w8kz9zz); Philips, J. (https://BioRender.com/negeejn). Source data are provided as a Source Data file.
Fig. 3
Fig. 3. SLAMF1 is induced in Mtb-infected macrophages in vivo.
AE C57Bl/6 mice were infected with ~200 CFU (A, B) or ~ 1000 CFU (CE) of mCherry Mtb for 4 weeks. A, C SLAMF1 positivity on infected (mCherrypos) and uninfected (mCherryneg) macrophages and monocytes was analyzed by flow cytometry. B, D SLAMF1 positivity of macrophages and monocytes from infected mice separated by MHCII status. A, B n = 19 mice from 6 independent experiments. A **** p = 4 × 10−15, 1.4 × 10−11, and 3.5 × 10−7 for pairwise comparisons for monocytes, CD11c- non-AMs and CD11c+ non-AMs, respectively. B ****p = 9 × 10−10 and 7 × 10−9 for pairwise comparison for monocytes and CD11c- non-AMs, respectively. A, B P value from matched Two-way ANOVA with Sidak’s multiple comparisons test. C, D n = 17 mice from 4 independent experiments. C **** p = 3 ×10⁻⁶; 1.2 ×10⁻⁵, and 2 ×10⁻⁶ for pairwise comparisons for monocytes, CD11c+ non-AMs, and AMs, respectively. C, D P value from matched Two-way ANOVA. E MFI of SLAMF1 in infected macrophages and monocytes compared to uninfected cells from the same mice. n = 22 mice from 5 independent experiments. P value from non-parametric multiple Wilcoxon t tests (F, G) C57Bl/6 mice were infected with ~150 CFU Mtb for 2, 4, and 8 weeks. F Representative lung SLAMF1 immunohistochemistry with higher magnification inset at 8 weeks post-infection. Quantitative image analysis showing weak (yellow), moderate (orange), and strong (red) SLAMF1 intensity. Hematoxylin staining is in blue. The arrow indicates high expression in macrophages adjacent to lymphocyte aggregate. Scale bar = 500 μm, inset enlarged scale bar = 100 μm (G) Total number of SLAMF1+ lung cells quantified by digital image analysis. n = 5 mice from one experiment, P value from Brown-Forsythe and Welch One-way ANOVA with Dunnett’s multiple comparison test. Data presented as mean values ± SEM. AE Each data point represents one mouse; lines connect data from the same mouse. Source data are provided as a Source Data file.
Fig. 4
Fig. 4. SLAMF1 expression in infected macrophages depends on adaptive immunity and autophagy.
AE WT, Rag1−/−, and Tcra−/− mice were infected with ~100 CFU mCherry Mtb for 4 weeks. AC SLAMF1 positivity on infected and uninfected monocytes and non-AMs is shown. P value from two-way ANOVA Mixed-effects model with Tukey’s multiple comparisons test. D, E SLAMF1 positivity of infected and uninfected monocytes and CD11c- non-AMs separated by MHCII status. P value from two-way ANOVA with Dunnett test. (A-E) n = 9 mice in each group. Data from 3 independent experiments. FH Tcra−/− mice were infected with ~100 CFU mCherry Mtb, and naïve T cells from WT mice were transferred 6 dpi. Lungs were harvested 5 wpi; FH SLAMF1 positivity in Mtb-infected and uninfected monocytes and non-AMs. (I, J) SLAMF1 positivity of infected and uninfected monocytes and CD11c- non-AMs separated by MHCII status. FJ Tcra−/− n = 9 mice; Tcra−/− + WT/T cells n = 10 mice. Data is from 2 independent experiments. P values from two-way ANOVA. K, L Atg5fl/fl, Atg7fl/fl, Atg14fl/fl Cre + , and Cre- littermate controls infected with ~1000 CFU GFP-Mtb for 17 days. K SLAMF1 positivity in Mtb-infected (GFPpos) and uninfected (GFPneg) monocytes and macrophages from Atg Cre- mice. n = 15 mice from 4 independent experiments. P value from two-way ANOVA with Sidak multiple comparisons test. Each data point represents one mouse; lines connect data from the same mouse. L SLAMF1 positivity in Mtb-infected and uninfected monocytes and macrophages from Cre- and Cre+ mice, as indicated. Cre- mice (Atg5fl/fl, Atg7fl/fl, Atg14fl/fl) were combined for the analysis. Cre- n = 15 mice; ATG5 cKO n = 10 mice; ATG7 cKO n = 9 mice; ATG14 cKO n = 8 mice from 2–3 independent experiments. P value from two-way ANOVA with Dunnett multiple comparisons test. (AJ, L) Each data point represents one mouse. AJ, L Data presented as mean values ± SEM. Source data are provided as a Source Data file.
Fig. 5
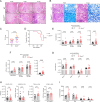
Fig. 5. SLAMF1 confers protection against Mtb.
A, B WT and Slamf1−/− mice were infected with ~150 CFU H37Rv Mtb. Representative lung histopathology at 2, 4, and 8 weeks post-infection (wpi). Slamf1−/− mice had prominent neutrophilic inflammation at 4 and 8 wpi. Scale bars = 200 μm. n = 5 mice per group. Data from one experiment. B Representative H&E and acid-fast staining at 4 and 8 wpi shows increased inflammation in Slamf1−/− as compared to WT mice. Scale bars = 20 μm (H&E); 10 μm (AFB). CH WT and Slamf1−/− mice were infected with ~1000 CFU H37Rv Mtb. C Lung Mtb burden was assessed 4 wpi. n = 22 mice. P value from two-tailed nonparametric Mann-Whitney t test. Data presented as mean values ± SEM. Different colors indicate independent experiments. D Survival was monitored (n = 15 mice per group). P value from Kaplan-Meier simple survival analysis. EG Lungs were harvested and analyzed by flow cytometry. E Total number of different myeloid cells in the lung. F Number of Mtb-infected myeloid subsets. G Number of lymphoid cells. H Total number and percentages of antigen-specific CD4+ and CD8+ T cells. I Cytokine levels in the lung homogenates. EG, I Each data point represents one mouse. Data consists of 12 mice from 3 independent experiments. **** p = 2 × 10−15, F **** p = 1.3 × 10−7, and G **** p = 7.5 × 10−13 comparing WT to Slamf1−/− using Kruskal-Wallis. EG, I Pairwise comparisons used the multiple Mann-Whitney tests. H n = 10–18 mice. P value from Mann-Whitney t test. EI Data presented as mean values ± SEM. Source data are provided as a Source Data file.
Fig. 6
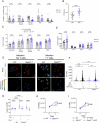
Fig. 6. Macrophage Slamf1 restricts Mtb growth in vivo and in vitro.
ASlamf1fl/fl LysM-Cre+ and Slamf1fl/fl Cre- mice were infected with ~1000 CFU Mtb (mCherry-H37Rv), and lungs were harvested 4 wpi for flow cytometry, cytokine analysis, and CFU. (A) SLAMF1 positivity on infected myeloid cells. B Lung Mtb burden. C Number of Mtb-infected myeloid subsets. D Cytokine levels in the lung homogenates. AD n = 17 mice in each group. Each data point represents one mouse. Data from 3 independent experiments. A **** p = 7.7  × 10−6 for pairwise comparison of CD11c+ non-AMs. C **** p = 1 × 10−15 comparing Cre- to Cre+ mice using Kruskal-Wallis. AD P values from multiple Mann-Whitney t tests. E Fluorescence microscopy images showing bacteria (smyc’::mCherry-red), reporter (hspX::GFP-green), nuclei (DAPI-blue) and heatmap images of GFP intensity. BMDMs infected with reporter Mtb and co-cultured with or without T cells. Scale bars = 10 μm. F MFI of hspX::GFP signal for each bacterium measured from 10–15 images in each group from 2 independent experiments. Each data point is from one bacteria or a tightly clustered group of bacteria. **** p = 5 × 10−9. P values are from one-way ANOVA with Tukey multiple comparisons test. G Intracellular ROS production was compared between WT and Slamf1−/− BMDMs. Macrophages were co-cultured with or without T cells upon P25 treatment. Each data point represents one biological replicate. n = 5-6 biological replicates from 3 independent experiments. P values from two-way ANOVA. H, I WT or Slamf1−/− BMDMs were treated with IFN-γ, infected with H37Rv Mtb, and co-cultured with P25 TcR Tg T cells. CFU were calculated 4 hpi (day 0) and 3 dpi. I Samples were treated with or without NAC as indicated from five (H) or two (I) independent experiments, each with 6 replicates. P values from paired Student’s t test (H), One-way ANOVA (I). AD, FI, Data presented as mean values ± SEM. Source data are provided as a Source Data file.

Similar articles

References

    1. WHO. Global tuberculosis report 2021. (World Health Organization, 2021).
    1. Cohen, S. B. et al. Alveolar macrophages provide an early mycobacterium tuberculosis niche and initiate dissemination. Cell host microbe24, 439–446 (2018). - PMC - PubMed
    1. Wolf, A. J. et al. Mycobacterium tuberculosis infects dendritic cells with high frequency and impairs their function in vivo. J. Immunol.179, 2509–2519 (2007). - PubMed
    1. Lee, J. et al. CD11cHi monocyte-derived macrophages are a major cellular compartment infected by Mycobacterium tuberculosis. PLoS Pathog.16, e1008621 (2020). - PMC - PubMed
    1. Caruso, A. M. et al. Mice deficient in CD4 T cells have only transiently diminished levels of IFN-gamma, yet succumb to tuberculosis. J. Immunol.162, 5407–5416 (1999). - PubMed

MeSH terms

Substances