

Coupling and coordination evaluation of digital economy and green development efficiency in eight urban agglomerations in China
- PMID: 40701977
- PMCID: PMC12287524
- DOI: 10.1038/s41598-025-07967-7
Coupling and coordination evaluation of digital economy and green development efficiency in eight urban agglomerations in China
Abstract
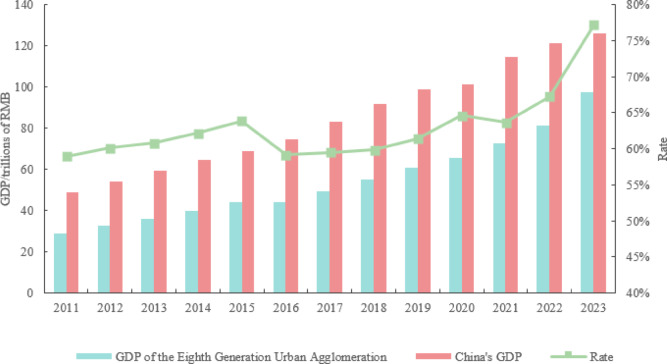
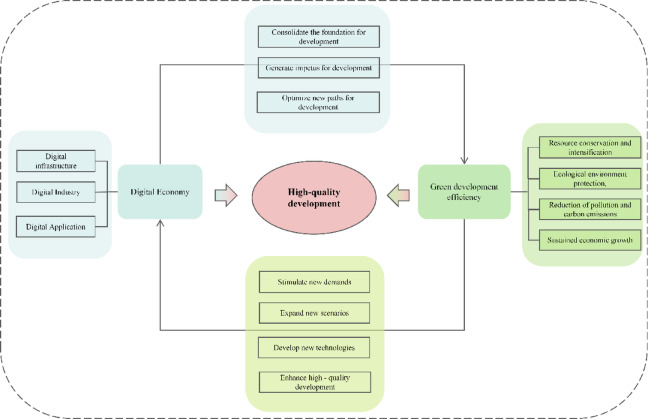
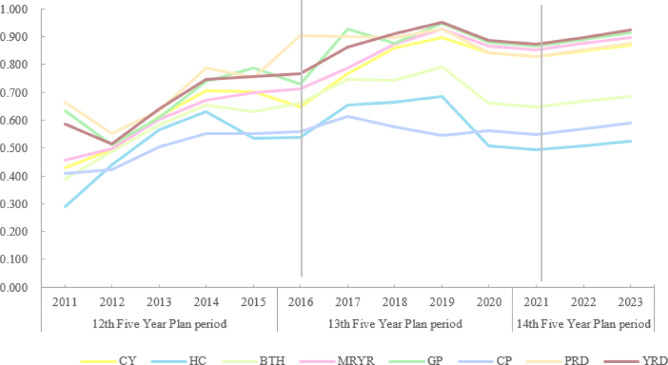
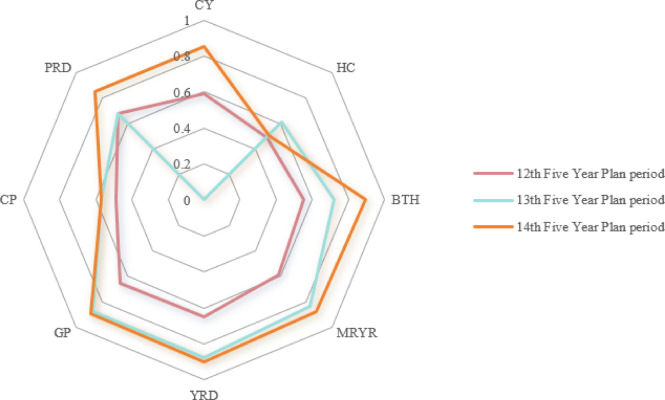
Promoting the coupling and coordinated development of the digital economy and green development efficiency within urban agglomerations is of vital importance for the construction of "Digital China" and "Beautiful China", and is also significant for achieving regional sustainable development. This paper uses the relevant data of 140 cities in the eight urban agglomerations in China from 2011 to 2023 to comprehensively measure the development levels and coordination degrees of the digital economy and green development efficiency from the perspective of urban agglomerations. Furthermore, by applying multi-index evaluation methods, the EBM-DEA model based on Pearson correlation coefficient, and the coupling coordination degree model, the systematic evaluation and relationship analysis of the digital economy and green development efficiency were carried out. The research results are as follows: (1) The overall coupling coordination degree of two systems in the eight major urban agglomerations in China shows a fluctuating growth trend, achieving a transformation from near imbalance to good coordination, but there are obvious phased characteristics and regional imbalances. (2) In the eight urban agglomerations, the overall Gini coefficient of the coupling coordination degree of these two systems shows a fluctuating downward trend, presenting a "rising-falling" inverted "V" shape feature, and the spatial differences gradually narrow. (3) The stability of the coupling coordination degree at all levels in the eight urban agglomerations is relatively high, with obvious solidification phenomena. The improvement process is gradual, and there is a certain risk of grade decline. These conclusions provide scientific basis for urban agglomerations to formulate precise policies, balance economic and ecological development, and achieve high-quality development.
Keywords: Digital economy; Green development efficiency; Multi-dimensional perspective; Spatial-temporal heterogeneity; Urban agglomerations.
© 2025. The Author(s).
Conflict of interest statement
Declarations. Competing interests: The authors declare no competing interests.
Figures


Similar articles
-
[Spatiotemporal Characteristics and Configuration Paths of the Coupling Coordinated Development between Digital Economy and Green Logistics under the Background of "Dual Carbon"].Huan Jing Ke Xue. 2025 Jul 8;46(7):4159-4174. doi: 10.13227/j.hjkx.202405286. Huan Jing Ke Xue. 2025. PMID: 40677038 Chinese.
-
[Spatio-temporal Correlation Between Green Space Landscape Pattern and Carbon Emission in Three Major Coastal Urban Agglomerations].Huan Jing Ke Xue. 2025 Jun 8;46(6):3509-3523. doi: 10.13227/j.hjkx.202403256. Huan Jing Ke Xue. 2025. PMID: 40582792 Chinese.
-
Coupling coordination evaluation and driving path of digital economy and carbon emission efficiency in China: A fuzzy-set qualitative comparative analysis based on 30 provinces.PLoS One. 2023 Oct 26;18(10):e0287819. doi: 10.1371/journal.pone.0287819. eCollection 2023. PLoS One. 2023. Retraction in: PLoS One. 2025 Aug 25;20(8):e0330563. doi: 10.1371/journal.pone.0330563. PMID: 37883359 Free PMC article. Retracted.
-
Systemic pharmacological treatments for chronic plaque psoriasis: a network meta-analysis.Cochrane Database Syst Rev. 2020 Jan 9;1(1):CD011535. doi: 10.1002/14651858.CD011535.pub3. Cochrane Database Syst Rev. 2020. Update in: Cochrane Database Syst Rev. 2021 Apr 19;4:CD011535. doi: 10.1002/14651858.CD011535.pub4. PMID: 31917873 Free PMC article. Updated.
-
Systemic pharmacological treatments for chronic plaque psoriasis: a network meta-analysis.Cochrane Database Syst Rev. 2021 Apr 19;4(4):CD011535. doi: 10.1002/14651858.CD011535.pub4. Cochrane Database Syst Rev. 2021. Update in: Cochrane Database Syst Rev. 2022 May 23;5:CD011535. doi: 10.1002/14651858.CD011535.pub5. PMID: 33871055 Free PMC article. Updated.
References
-
- Di, K. et al. Analysing the impact of coupled domestic demand dynamics of green and low-carbon consumption in the market based on SEM-ANN. J. Retail. Consumer Serv.79, 103856 (2024).
-
- Zhang, J. et al. How do renewable energy policies affect energy green development? Evidence from Chinese listed energy firms. Energy Econ. 108154. (2024).
-
- Wang, S. et al. Decarbonizing china’s urban agglomerations. Annals Am. Association Geographers. 109 (1), 266–285 (2019).
-
- Dogan, B. et al. The impact of the green technology on the renewable energy innovation: fresh pieces of evidence under the role of research & development and digital economy. Renew. Sustain. Energy Rev.210, 115193 (2025).
-
- Di, K. et al. Digital empowerment and win-win co-operation for green and low-carbon industrial development: analysis of regional differences based on GMM-ANN intelligence models. J. Clean. Prod.445, 141332 (2024).
LinkOut - more resources
Full Text Sources
