. 2025 Jul 23;14(1):26.
doi: 10.1038/s41389-025-00568-z.

Targeting SLC7A5 in lung squamous cell carcinoma: implications for cancer metabolism shift and boron neutron capture therapy resistance

Affiliations

Targeting SLC7A5 in lung squamous cell carcinoma: implications for cancer metabolism shift and boron neutron capture therapy resistance

Yen-Ju Lin et al. Oncogenesis. .

Abstract

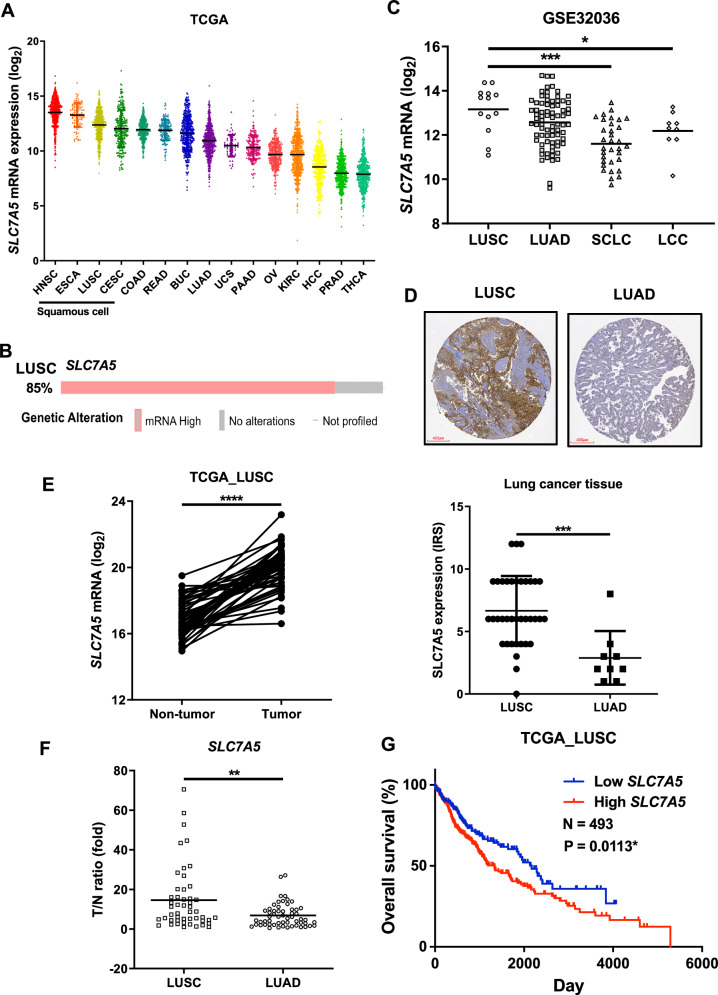
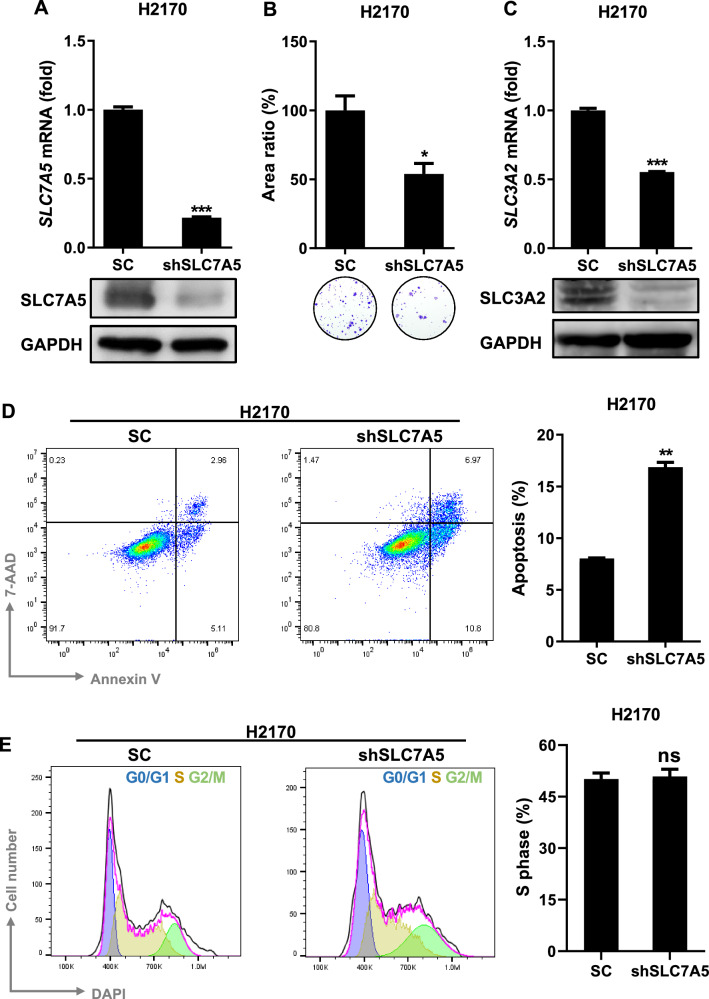
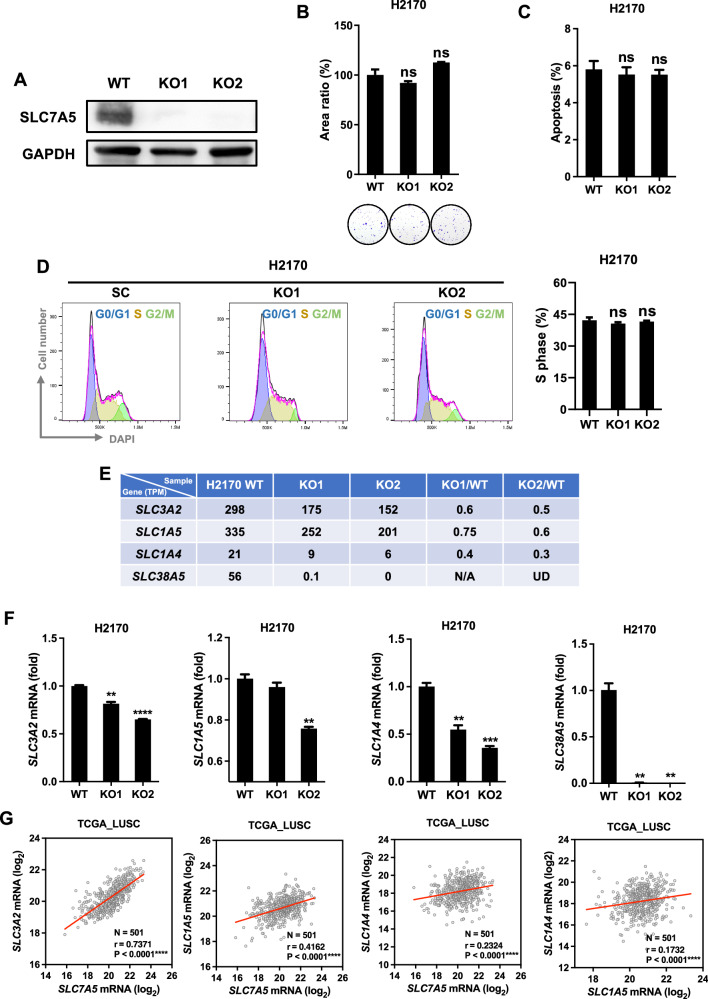
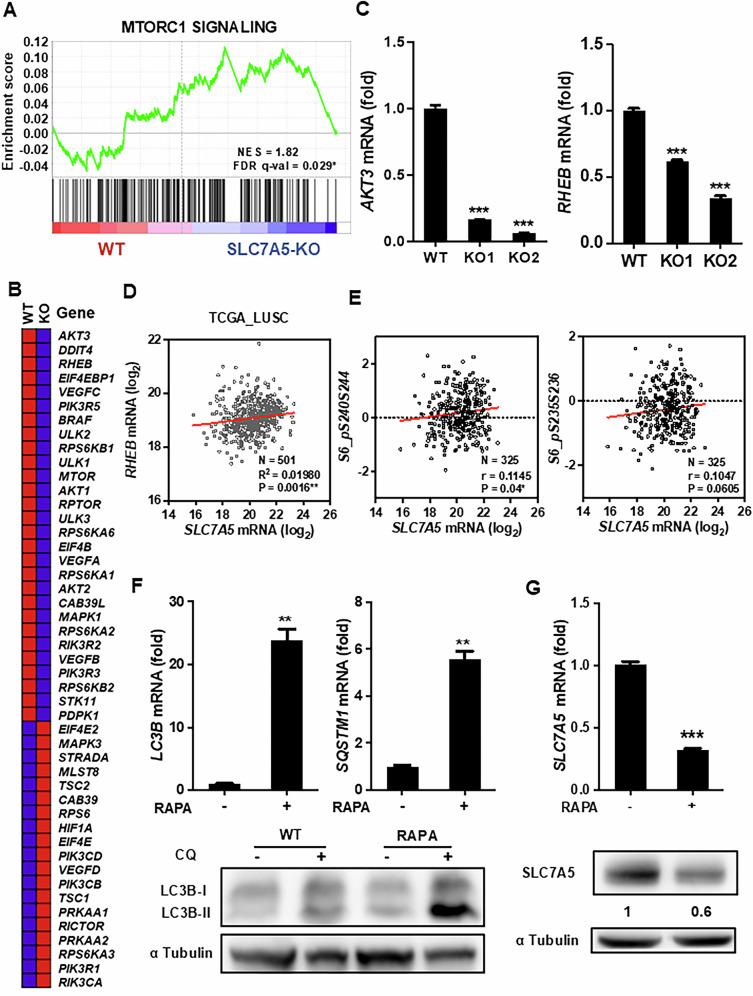
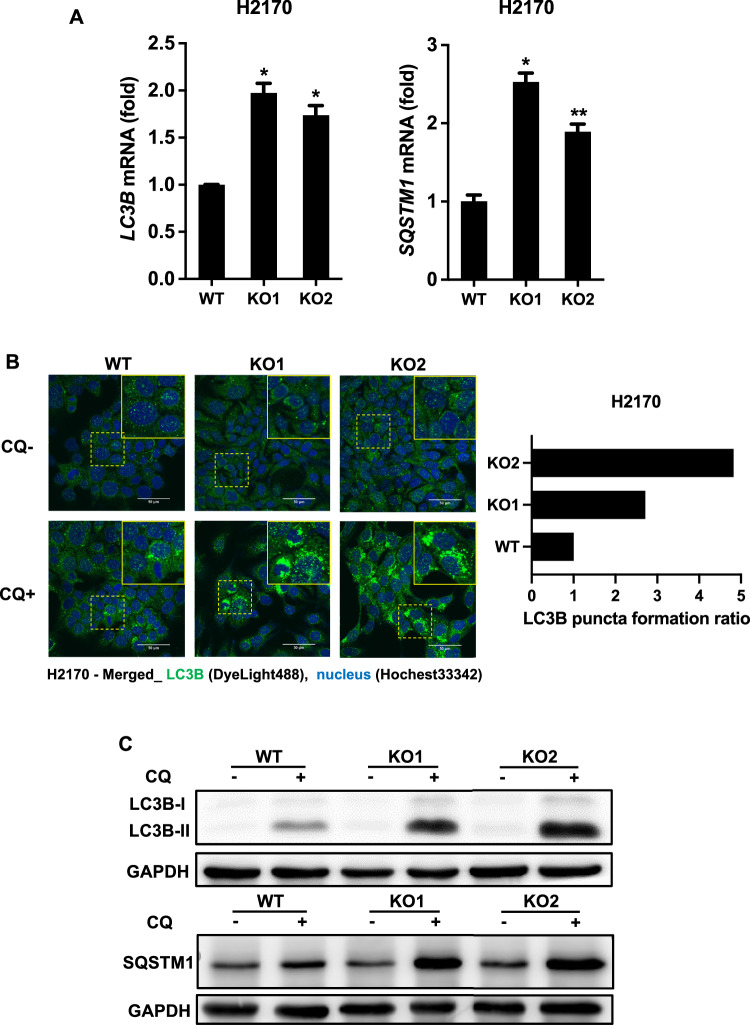
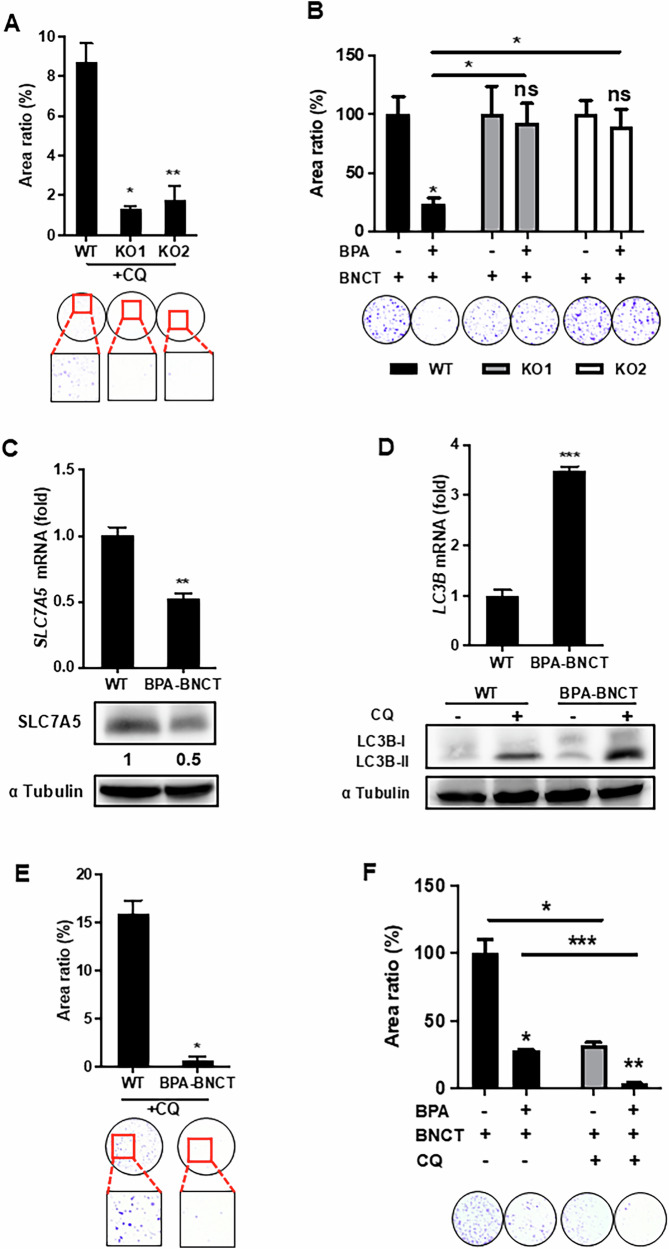
Squamous cell carcinoma (SCC) poses a significant global health challenge due to the lack of effective treatments. Boron neutron capture therapy (BNCT), a targeted particle therapy, has shown promising results in various cancers. SLC7A5, a transporter of essential amino acids and boronophenylalanine (BPA) used in BNCT, emerges as a potential therapeutic target. However, its expression across different histological subtypes and the role of SLC7A5 inhibition in developing drug resistance to BPA-BNCT remain poorly understood. Our study reveals elevated SLC7A5 expression in most SCCs, particularly in lung squamous cell carcinoma (LUSC), where it is significantly higher compared to other lung cancer subtypes. Increased SLC7A5 expression and a higher tumor-to-normal (T/N) ratio in LUSC are associated with poor patient prognosis. SLC7A5 knockdown in LUSC cells reduces colony formation and induces apoptosis. RNA-seq analysis of SLC7A5 knockout LUSC cells shows downregulated mTORC1 signaling, reduced expression of other amino acid transporters, and upregulated autophagy genes, indicating a potential cancer metabolic shift. Furthermore, SLC7A5 knockout LUSC cells demonstrate resistance to BPA-BNCT but sensitivity to the autophagy inhibitor chloroquine. Post-BPA-BNCT treatment, surviving wild-type LUSC cells exhibit reduced SLC7A5 levels and increased sensitivity to chloroquine, highlighting a vulnerability in BPA-BNCT-resistant cells. Our findings elucidate the interplay between SLC7A5, mTOR signaling, and autophagy pathways, providing insights into potential strategies to overcome drug resistance in BPA-BNCT therapy.


Conflict of interest statement

Competing interests: The authors declare no competing interests.

Figures

Fig. 1
Fig. 1. High SLC7A5 expression in lung squamous cell carcinoma.
A RNA-seq analysis of SLC7A5 expression in the specified cancers from the TCGA database. HNSCC head and neck squamous cell carcinoma, ESCA esophageal carcinoma, LUSC lung squamous cell carcinoma, CESC cervical squamous cell carcinoma, COAD colorectal adenocarcinoma, READ rectum adenocarcinoma, BUC bladder urothelial carcinoma, LUAD lung adenocarcinoma, UCS uterine carcinosarcoma, PAAD pancreatic adenocarcinoma, OV ovarian serous cystadenocarcinoma, KIRC kidney renal clear cell carcinoma, HCC liver hepatocellular carcinoma, PRAD prostate adenocarcinoma, THCA thyroid carcinoma. B Percentage of high SLC7A5 expression in tumors versus normal tissues in LUSC from the cBioPortal database. C Gene expression profiling analysis showing SLC7A5 expression in different histologic subtypes of lung cancer tumors from the GSE32036 database. LUSC Lung squamous cell carcinoma, LUAD lung adenocarcinoma, SCLC small cell lung cancer, LCC large cell carcinoma. *p < 0.05; ***, p < 0.001. D Representative images (upper) and quantitative analysis (lower) of SLC7A5 expression by immunohistochemistry assay of LUSC and LUAD tissues from the lung cancer tissue array (Superbiochips, CC5). ***p < 0.001. E RNA-seq analysis revealing SLC7A5 expression in paired LUSC primary tumor and solid normal tissue samples from the TCGA-LUSC database. ***p < 0.001. F Tumor-to-normal (T/N) ratio of SLC7A5 expression in LUSC and LUAD from the TCGA database. **p < 0.01. G Kaplan–Meier analysis demonstrating the correlation of SLC7A5 expression with the overall survival of LUSC from the TCGA-LUSC database. *p < 0.05.
Fig. 2
Fig. 2. Silencing SLC7A5 expression induces apoptosis in LUSC cells.
A RT-qPCR (upper) and immunoblotting (lower) analyses of SLC7A5 expression in H2170 cells transduced with lentiviral particles encoding shRNA against SLC7A5 (shSLC7A5) or scrambled control (SC). ***p < 0.001. B Clonogenic assay assessing colony growth of H2170 cells transduced with shSLC7A5 or scrambled control (SC). Colonies were stained with crystal violet (bottom) and quantified by ImageJ software (top). *p < 0.05. C RT-qPCR (upper) and immunoblotting (lower) analyses of SLC3A2 expression in H2170 cells transduced with shSLC7A5 or scrambled control (SC). ***p < 0.001. D Annexin V flow cytometric analysis assessing the apoptotic rate of H2170 cells transduced with shSLC7A5 or scrambled control (SC). **p < 0.01. E Flow cytometric analysis of cell cycle distribution in H2170 cells transduced with shSLC7A5 or scrambled control (SC). ns, p > 0.05.
Fig. 3
Fig. 3. Knockout of SLC7A5 in LUSC cells.
A Immunoblotting analysis of SLC7A5 expression in wild-type H2170 (WT) and its SLC7A5 knockout cells (KO1 and KO2), which harbor differential deletion/mutation regions in the SLC7A5 coding region. B Clonogenic assay assessing colony growth of H2170 and its SLC7A5 knockout cells (KO1 and KO2). Colonies were stained with crystal violet (bottom) and quantified by ImageJ software (top). ns, p > 0.05. C Annexin V flow cytometric analysis assessing the apoptotic rate in H2170 and its SLC7A5 knockout cells (KO1 and KO2). ns, p > 0.05. D Flow cytometric analysis of the cell-cycle distribution in H2170 and its SLC7A5 knockout cells (KO1 and KO2). ns, p > 0.05. E RNA-seq analysis assessing the indicated amino acid transporter gene (SLC3A2, SLC1A5, SLC1A4, and SLC38A5) expression in H2170 and its SLC7A5 knockout cells (KO1 and KO2). F RT-qPCR analysis assessing amino acid transporter gene (SLC3A2, SLC1A5, SLC1A4, and SLC38A5) expression in H2170 and its SLC7A5 knockout cells (KO1 and KO2). **p < 0.01; ***p < 0.001. G Scatter plot analysis assessing the correlation between indicated amino acid transporter genes SLC7A5, SLC3A2, SLC1A5, and SLC1A4 expression in lung squamous cell carcinoma from the TCGA database. ***p < 0.001.
Fig. 4
Fig. 4. SLC7A5 knockout LUSC cells harbor deficient mTORC1 signaling.
A Gene set enrichment analysis (GSEA) of RNA-seq data assessing mTORC1 signaling-associated gene expression in wild-type H2170 (WT) versus its SLC7A5 knockout cells (SLC7A5-KO). B Gene set of the mTORC1 signaling pathway in wild-type H2170 (WT) versus its SLC7A5 knockout cells (KO) from RNA-seq data. C RT-qPCR analysis assessing mTOR pathway-related gene (AKT3 and RHEB) expression in wild-type H2170 and SLC7A5 knockout cells (KO1 and KO2). ***p < 0.001. D Scatter plot analysis assessing the correlation between SLC7A5 and RHEB expression in LUSC tumors from the TCGA-LUSC database. **p < 0.01. E Scatter plot analysis assessing the correlation of SLC7A5 with phospho-S6 (pS240S244 and pS235S236) protein expression in LUSC tumors from the TCGA-LUSC database. *p < 0.05. F RT-qPCR analysis (upper) assessing LC3B and SQSTM1 expression in H2170 in the presence or absence of rapamycin (RAPA, 20 μM) for one month. Immunoblotting analysis (lower) assessing LC3B-I and LC3B-II expression in wild-type (WT) H2170 and H2170-RAPA cells treated with or without chloroquine (CQ). **p < 0.01. G RT-qPCR (upper) and immunoblotting (lower) analysis assessing SLC7A5 expression in H2170 and H2170-RAPA cells. ***p < 0.001.
Fig. 5
Fig. 5. High autophagy activity in SLC7A5 knockout LUSC cells.
A RT-qPCR analysis assessing autophagy pathway-related gene (LC3B and SQSTM1) expression in H2170 and SLC7A5 knockout cells (KO1 and KO2). *p < 0.05; **p < 0.01. B Representative images (left) of confocal analysis for assessing LC3B-II mediated fluorescent puncta formation in H2170 and its SLC7A5 knockout cells (KO1 and KO2) treated with or without chloroquine (CQ). LC3B-II mediated fluorescent puncta levels (right) in chloroquine-treated groups were normalized to the corresponding untreated group. C Immunoblotting analysis of LC3B expression (upper) and SQSTM1 expression (lower) in H2170 and its SLC7A5 knockout cells (KO1 and KO2) treated with or without chloroquine (CQ).
Fig. 6
Fig. 6. SLC7A5-deficient LUSC cells are resistant to BPA-BNCT but sensitive to autophagy inhibitors.
A Clonogenic assay assessing colony growth of H2170 and its SLC7A5 knockout cells (KO1 and KO2) treated with chloroquine (CQ, 30 μM). Colonies were stained with crystal violet (bottom) and quantified by ImageJ software (top). *p < 0.05; **p < 0.01. B Clonogenic assay assessing colony growth of H2170 and its SLC7A5 knockout cells (KO1 and KO2) treated with or without BPA-BNCT. Colonies were stained with crystal violet (bottom) and quantified by ImageJ software (top). ns, p > 0.5; *p < 0.05. C RT-qPCR (upper) and immunoblotting (lower) analysis assessing SLC7A5 expression in wild-type (WT) H2170 and its BPA-BNCT-treated surviving cells (BPA-BNCT). **p < 0.01. D RT-qPCR analysis (upper) assessing LC3B expression in wild-type (WT) H2170 and its BPA-BNCT-treated surviving cells (BPA-BNCT). Immunoblotting analysis (lower) assessing LC3B-I and LC3B-II expression in wild-type (WT) H2170 and its BPA-BNCT-treated surviving cells (BPA-BNCT) in the presence or absence of chloroquine (CQ). ***p < 0.001. E Clonogenic assay (lower) assessing colony growth of wild-type (WT) H2170 and BPA-BNCT-treated surviving cells (BPA-BNCT) in the presence or absence of chloroquine (CQ, 20 μM). Colonies were stained with crystal violet (bottom) and quantified by Image. *p < 0.05. F Clonogenic assay assessing colony growth of wild-type (WT) H2170 treated with or without BPA-BNCT in the presence or absence of chloroquine (CQ, 20 μM). *p< 0.05; **p< 0.01; ***p< 0.001.

Similar articles

References

    1. Kahlhofer J, Teis D. The human LAT1-4F2hc (SLC7A5-SLC3A2) transporter complex: Physiological and pathophysiological implications. Basic Clin Pharm Toxicol. 2023;133:459–72. - PMC - PubMed
    1. Kanai Y, Segawa H, Miyamoto K, Uchino H, Takeda E, Endou H. Expression cloning and characterization of a transporter for large neutral amino acids activated by the heavy chain of 4F2 antigen (CD98). J Biol Chem. 1998;273:23629–32. - PubMed
    1. Park G, Fukasawa K, Horie T, Masuo Y, Inaba Y, Tatsuno T, et al. l-Type amino acid transporter 1 in hypothalamic neurons in mice maintains energy and bone homeostasis. JCI Insight. 2023;8:e154925. - PMC - PubMed
    1. Kanai Y. Amino acid transporter LAT1 (SLC7A5) as a molecular target for cancer diagnosis and therapeutics. Pharm Ther. 2022;230:107964. - PubMed
    1. Kim CS, Cho SH, Chun HS, Lee SY, Endou H, Kanai Y, et al. BCH, an inhibitor of system L amino acid transporters, induces apoptosis in cancer cells. Biol Pharm Bull. 2008;31:1096–100. - PubMed

LinkOut - more resources