. 2025 Jul 23;16(1):6786.
doi: 10.1038/s41467-025-62133-x.

Homeostatic scaling of dynorphin signaling by a non-canonical opioid receptor

Affiliations

Homeostatic scaling of dynorphin signaling by a non-canonical opioid receptor

Xiaona Li et al. Nat Commun. .

Abstract

The endogenous opioid system provides powerful control over emotions, nociception, and motivation among many other fundamental nervous system functions. Its major components include a panel of opioid peptides that activate four canonical inhibitory opioid receptors. However, its regulatory principles are not fully understood including the existence of additional receptors and other elements. In this study we report the identification of a receptor for the opioid peptide dynorphin. By conducting a screen of a custom library of neuropeptides, we found that orphan receptor GPR139 binds to and is activated by a series of dynorphin peptides. Unlike other opioid receptors, GPR139 couples to Gq/11 and avoids β-arrestin, providing excitatory signaling that homeostatically scales the inhibitory response of neurons to dynorphin. This introduces a non-canonical dynorphin receptor as an essential component of the opioid system.


Conflict of interest statement

Competing interests: K.A.M. is a consultant and stakeholder in EvoDenovo, Inc. a company commercializing the development of innovative treatments for opioid use disorder. All other authors declare no competing interests.

Figures
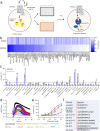
Fig. 1
Fig. 1. Activation of GPR139 by prodynorphin derived peptides.
a Schematic of screening assay design. b Screening results of ~100 neuropeptides (10 μM) using Calcium 5 assay. Untransfected HEK293T/17 cells were used as negative control. Data were normalized to the 10 μM JNJ-63533054 signal. c Quantification of CalFluxVTN BRET signal of 36 hits at 10 μM. Data were normalized to 10 μM JNJ-63533054. d Traces of BRET signal change in CalFluxVTN assay elicited by 10 μM JNJ-63533054 and 40 μM dynorphin peptides. e The concentration dependence of GPR139 activation by PDYN-derived peptides. Data were normalized to 10 μM JNJ-63533054. f The amino acid sequence of PDYN-derived peptides. Data shown are mean ± SEM of n = 3 independent experiments. Data in (c) were analyzed by two-way ANOVA with Tukey’s test. *p < 0.05, **p < 0.01 and ***p < 0.001.
Fig. 2
Fig. 2. Dynorphin peptides directly bind to GPR139.
a Schematic of radioligand binding competition assays using cell membranes overexpressing GPR139. b Binding of 10 μM JNJ-63533054 and 40 μM dynorphin peptides to the membranes from HEK293T/17 cells transfected with GPR139 following co-incubation with 10 nM [3H]-JNJ-63533054. c Binding competition of [3H]-JNJ-63533054 with increasing concentration of dynorphin peptides. d Schematic of experimental design for detecting FITC-Dyn A13 binding to GPR139 by flow cytometry. e Flow cytometry histogram of cell population distribution after cell sorting. f Quantification of 1 μM FITC-Dyn A13 binding from (e). Median Fluorescence Intensity (MFI) was calculated. g Binding of 10 μM JNJ-63533054 and 40 μM Dyn A17 to the membranes from WT mouse brains in the presence of 10 nM [3H]-JNJ-63533054. h Binding competition of [3H] JNJ-63533054 with increasing concentration of Dyn A17. Data were normalized to specific binding of 10 nM [3H]-JNJ-63533054. i Quantification of the IC50 values from the binding displacement curves in (h). Data are mean ± SEM from n = 3 independent experiments. In (b, g), data were analyzed by one-way ANOVA with Dunnett’s test or unpaired two-tailed t-test for (f, i). *p < 0.05, **p < 0.01, ***p < 0.001, and ****p < 0.0001.
Fig. 3
Fig. 3. Dynorphin peptides signal via G proteins but not β-arrestin.
a Schematic of G protein BRET fingerprinting assay. G protein coupling activity was measured by the BRET signal between Gβγ-venus and masGRK3ct-Nanoluc upon GPR139 activation by dynorphin peptides. b The maximum amplitude of responses mediated by 15 G proteins upon application of 40 μM Dyn A13. Data are normalized to the response of GαoA. c Initial rate of responses mediated by 15 G proteins upon application of 40 μM Dyn A13. GPR139 mediated activation on GαoA (d) and Gα11 (g) by dynorphin peptides. The maximum amplitude of GαoA (e) and Gα11 (h) activation across different concentration of Dyn A13 and Dyn A17. The EC50 of GαoA (f) and Gα11 (i) coupling. j Schematic of agonist-induced LgBit-β-arrestin recruitment assay in HEK293T/17 cell. k Basal luminescence signal of GPR139-SmBit paired with LgBit-β-arrestin1 or LgBit-β-arrestin2. β-arrestin recruitment kinetics of GPR139-SmBit/LgBit-β-arrestin1 (l) and GPR139-SmBit/LgBit-β-arrestin2 (m) upon application of 40 μM Dyn A13 and 40 μM Dyn A17. Data shown are mean ± SEM of n = 3 independent experiments.
Fig. 4
Fig. 4. Dynorphin peptides induce β-arrestin independent internalization of GPR139.
a Co-expression of KRas-Venus and HA-GPR139 in HEK293T/17 cells. The cells were treated with 40 μM Dyn A13 for 5 min. b HA-GPR139 fluorescence intensity distribution across the line in (a). c Mander’s colocalization coefficient (MOC) analyzed from 11 images (25 cells for control group and 28 cells for Dyn A13 group). d Schematic of luminescence assay for examining cell surface abundance and internalization of GPR139. e Cell surface abundance of GPR139 in HEK293T/17 and β-arrestin1/2 KO cells. Time course of Dyn A13 and Dyn A17 initiated HiBit-GPR139 internalization in HEK293T/17 (f) and in β-arrestin1/2 KO cells (i). Quantification of the internalization of GPR139 in HEK293T/17 (g) and in β-arrestin1/2 KO cells (j). The maximum internalization of GPR139 in HEK293T/17 (h) and β-arrestin1/2 KO cells (k) across different concentrations of Dyn A13 and Dyn A17. l The effect of 40 μM Dyngo-4a, 10 μM PitStop 2 and 4 mM MβCD applied 15 min before the assay on the time course of Hibit-GPR139 internalization induced by 40 μM Dyn A13 in HEK293T/17 cells. m The maximum internalization of GPR139 in HEK293T/17 cells under different treatments. Data are mean ± SEM of n = 3 independent experiments. Data were analyzed by unpaired two-tailed t-test (c, e) or one-way ANOVA with Dunnett’s test (g, j, m). ** p < 0.01, *** p < 0.001, n.s. p > 0.05.
Fig. 5
Fig. 5. Homeostatic scaling of MOR responses by GPR139.
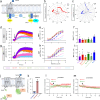
a Schematic of cAMP signaling platform to study the influence of GPR139 co-expression on MOR activation by different ligands. b Concentration-response curve for DAMGO-mediated MOR activation with or without GPR139 co-expression. c Concentration-response curve for DAMGO-mediated MOR activation with or without GPR139 co-expression in the presence of 10 μM JNJ-63533054. d Maximum efficacy of DAMGO-mediated activation of MOR and MOR co-expressed with GPR139. e The negative logarithm of the EC50 (pEC50) of DAMGO-mediated activation of MOR with and without GPR139 co-expression. f Concentration-response curve for Dyn A13-mediated MOR activation with or without GPR139 co-expression. g Maximum efficacy of Dyn A13-mediated activation of MOR and MOR upon co-expression with GPR139. h The negative logarithm of the EC50 (pEC50) of Dyn A13-mediated activation of MOR and MOR upon co-expression with GPR139. i Schematic of luminescence complementation assay to detect change in cell surface abundance of MOR. Time course of changes in MOR cell surface abundance upon treatment with DAMGO (j) and Dyn A13 (k). Quantification of MOR internalization by DAMGO (l) and Dyn A13 (n). Quantification of MOR internalization rate in response to DAMGO (m) and Dyn A13 (o). Data shown are mean ± SEM of n = 3 independent experiments. Data were analyzed by d two-way ANOVA with Fisher’s least significant difference test, e one-way ANOVA with Dunnett’s test or (g, h, l, m, n, o) unpaired two-tailed t-test. *p < 0.05, **p < 0.01 and ***p < 0.001, n.s. p > 0.05.
Fig. 6
Fig. 6. GPR139-mediated dynorphin signaling in native neurons and intact circuits.
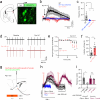
a Experimental design of recording calcium imaging utilizing jGCaMP7s sensor in medial habenula (MHb) region of mice. b Average of calcium response in MHb neurons of WT and Gpr139 KO mice after puff application with 100 μL of 160 μM Dyn A17 (WT n = 6 cells from 4 mice; WT/JNJ-3792165 n = 7 cells from 4 mice; Gpr139 KO, n = 6 cells from 4 mice). c Quantification of area under curve of calcium response in (b). n = 6 cells from 4 mice for WT; n = 7 from 4 mice for WT/JNJ-3792165, and n = 6 cells from 4 mice for Gpr139 KO. d Representative traces (n = 8 cells from WT mice and n = 11 cells from Gpr139 KO mice) of spontaneous firing activity of MHb neurons in brain slices from WT and Gpr139 KO mice with and without 500 nM Dyn A application. e Time course of normalized firing frequencies of MHb neurons at baseline and following Dyn A application. f Quantification of maximal drug effect as the averaged normalized firing frequency during min 9-10 (WT n = 8 cells from 4 mice; Gpr139 KO n = 11 cells from 5 mice). g Schematic of viral targeting of jGCaMP7s and Flex-ChrimsonR-tdTomato to the nucleus accumbens (NAc) and optogenetic stimulation. ISI inter-stimulation interval. h Average jGCaMP7s responses to optical stimulation in the presence or absence of 10 μM JNJ-3792165 in Pdyn+ that express ChrimsonR-tdTomato (black, n = 4 cells from 3 mice; maroon, n = 3 cells from 3 mice) and in Pdyn- neurons that do not express ChrimsonR-tdTomato (n = 7 cells from 4 mice). i Quantification of the area under the curve calculated from traces in (h). n = 4 cells from 3 mice for Pdyn+ Block; n = 3 cells from 3 mice for Pdyn+ Control. Data are mean ± SEM. Data were analyzed by (c) One-way ANOVA with Dunnett’s post hoc test, (e) Two-way ANOVA with Holm-Šídák’s test, (f) unpaired two-tailed t-test or (i) paired two-tailed t-test. *p < 0.05, **p < 0.01.
Fig. 7
Fig. 7. Proposed role of GPR139 in homeostatic scaling of inhibitory effects of dynorphin.
At a low level of dynorphin release, only canonical opioid receptors (MOR/KOR/DOR) are engaged to inhibit neuronal activity via Gi/o signaling. More dynorphin release upon increase in the activity of dynorphinergic neurons progressively engages GPR139, which gradually counteracts MOR/KOR/DOR thereby avoiding excessive silencing of neuronal activity to maintain operating range of the circuit. Created in BioRender. Martemyanov, K. (2025) https://BioRender.com/mlzlbxs.

References

    1. D’Amato, F. R. & Pavone, F. Modulation of nociception by social factors in rodents: contribution of the opioid system. Psychopharmacology224, 189–200 (2012). - PubMed
    1. Gavériaux-Ruff, C. & Kieffer, B. L. Opioid receptor genes inactivated in mice: the highlights. Neuropeptides36, 62–71 (2002). - PubMed
    1. Darcq, E. & Kieffer, B. L. Opioid receptors: drivers to addiction? Nat. Rev. Neurosci.19, 499–514 (2018). - PubMed
    1. Nummenmaa, L. & Tuominen, L. Opioid system and human emotions. Br. J. Pharmacol.175, 2737–2749 (2018). - PMC - PubMed
    1. Lutz, P.-E. & Kieffer, B. L. Opioid receptors: distinct roles in mood disorders. Trends Neurosci.36, 195–206 (2013). - PMC - PubMed

LinkOut - more resources