

Mining genetic loci and candidate genes related to salt tolerance traits in soybean
- PMID: 40702013
- PMCID: PMC12287287
- DOI: 10.1038/s41598-025-08702-y
Mining genetic loci and candidate genes related to salt tolerance traits in soybean
Abstract
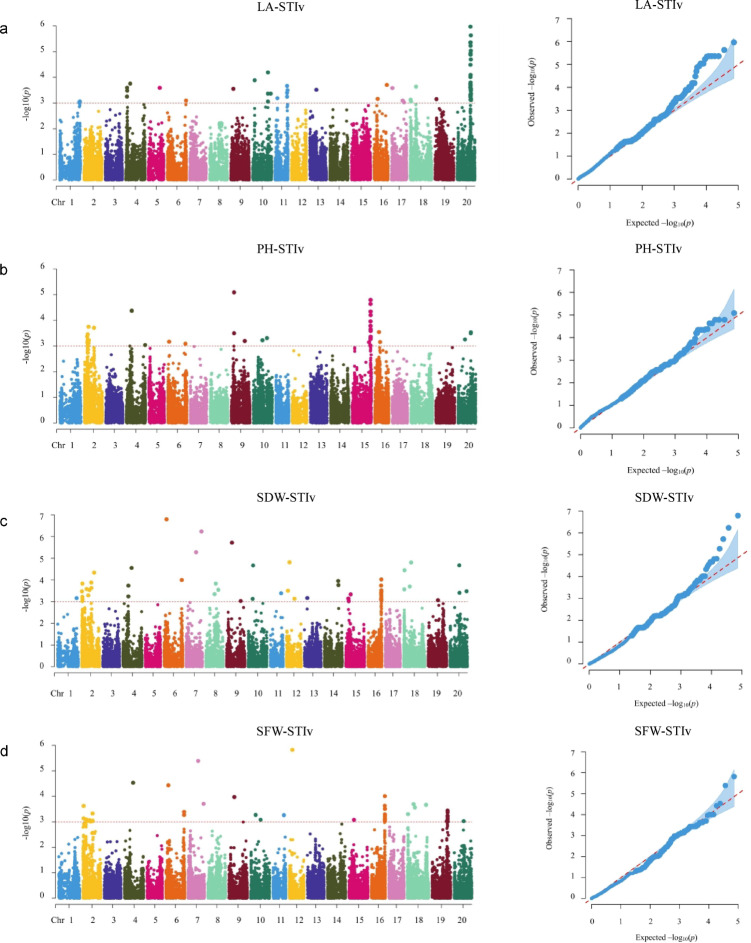
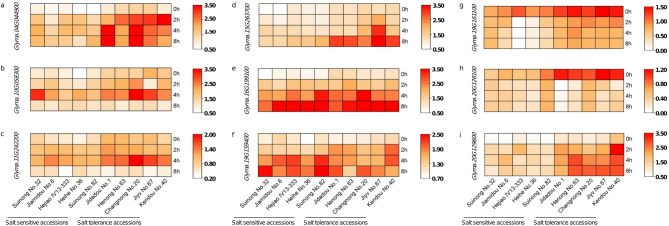
Soybean is an important crop worldwide that provides ~ 50% oil for humans. Salinity is a major abiotic stress that inhibits soybean growth and yield. Dissecting the genetic basis of salt tolerance is an effective way for soybean plants to combat salt-related yield losses. In this study, the variety salt tolerance index (STIv) of a natural population of 140 soybean germplasms was calculated in terms of plant height (PH), leaf area (LA), shoot fresh weight (SFW) and shoot dry weight (SDW), which were measured under normal condition and in a 1.50% NaCl solution. GWAS analysis was subsequently conducted on the basis of STIv and 150 K SNP markers of "Zhongdouxin-1". The results revealed that 365 significant SNPs located on 19 chromosomes (excluding Gm03) were associated with STIv. Among them, 108 SNPs were associated with LA-STIv, 71 SNPs associated with PH-STIv, 95 SNPs associated with SDW-STIv and 91 SNPs associated with SFW-STIv. A total of 333 genes were identified according to the flanking region (150 kb) of the significant SNPs. 333 genes were identified. Based on gene functional annotations, SNP mutations, and RNA expressions, nine causal genes responsible for soybean salt tolerance were identified. Thus, the significantly associated SNPs and candidate genes detected in this study might provide novel insights into soybean salt tolerance in breeding programs.
Keywords: Candidate genes; GWAS; Salt tolerance-related traits; Soybean.
© 2025. The Author(s).
Conflict of interest statement
Declarations. Competing interests: The authors declare no competing interests.
Figures


Similar articles
-
Genome-wide association study reveals the QTLs and candidate genes associated with seed longevity in soybean (Glycine max (L.) Merrill).BMC Plant Biol. 2025 Jul 2;25(1):829. doi: 10.1186/s12870-025-06822-1. BMC Plant Biol. 2025. PMID: 40604443 Free PMC article.
-
Conditional QTL/QTN mapping for seed width and mining candidate genes based on soybean FW-RIL population.Mol Genet Genomics. 2025 Jun 20;300(1):60. doi: 10.1007/s00438-025-02271-5. Mol Genet Genomics. 2025. PMID: 40540235
-
The combination of linkage mapping, genome-wide association study, and dynamic transcriptome analysis reveals conserved candidate genes for salt tolerance in maize.Theor Appl Genet. 2025 Jul 19;138(8):186. doi: 10.1007/s00122-025-04975-z. Theor Appl Genet. 2025. PMID: 40684070
-
A meta-analysis of genome-wide association studies to identify candidate genes associated with feed efficiency traits in pigs.J Anim Sci. 2025 Jan 4;103:skaf010. doi: 10.1093/jas/skaf010. J Anim Sci. 2025. PMID: 39847436 Free PMC article.
-
Home treatment for mental health problems: a systematic review.Health Technol Assess. 2001;5(15):1-139. doi: 10.3310/hta5150. Health Technol Assess. 2001. PMID: 11532236
References
-
- Kan, G. Z. et al. Association mapping of soybean seed germination under salt stress. Mol. Genet. Genom.290, 2147–2162 (2015). - PubMed
-
- Wang, D. & Shannon, M. C. Emergence and seedling growth of soybean cultivars and maturity groups under salinity. Plant Soil214, 117–124 (1999).
-
- Parker, M. B., Gascho, G. J. & Gains, T. P. Chloride toxicity of soybeans grown on Atlantic Coast flatwoods soils. Agron. J.75, 439–443 (1983).
-
- Chinnusamy, V., Jagendorf, A. & Zhu, J. K. Understanding and improving salt tolerance in plants. Crop Sci.45, 437–448 (2005).
-
- Munns, R. et al. Wheat grain yield on saline soils is improved by an ancestral Na+ transporter gene. Nat. Biotechnol.30, 4 (2012). - PubMed
MeSH terms
Grants and funding
LinkOut - more resources
Full Text Sources
