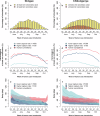
Cross-sectional entomological data reveals an increased risk of arboviral transmission in a year of record-breaking heat in Southern Europe
- PMID: 40702118
- PMCID: PMC12287341
- DOI: 10.1038/s43856-025-00983-8
Cross-sectional entomological data reveals an increased risk of arboviral transmission in a year of record-breaking heat in Southern Europe
Abstract
Background: In 2023, an unprecedentedly high number of locally acquired cases of dengue virus occurred in Europe, including the first large outbreak in Rome (Italy). Globally, 2023 was warmer than any previous year on record since 1850, with each month from June to December being warmer than the corresponding month in previous years.
Methods: We conducted an extensive analysis of entomological data in Rome to investigate how the unprecedentedly high temperatures seen in 2023 affected the abundance and seasonal dynamics of the local vector Aedes albopictus population and the risk of autochthonous transmission of both dengue and chikungunya viruses. We applied a mathematical dynamic temperature-based model to analyse adult mosquito collections in 2023 compared to those available for 2012 and assess the consequent changes in the risk of arboviral transmission. Simulations of potential local transmission triggered by disease importation were used to evaluate the effectiveness of human and entomological surveillance for monitoring transmission risks, providing insights for future action plans RESULTS: Results highlight a higher abundance and longer active season of Ae. albopictus as well as a higher risk of local arbovirus transmission in 2023.
Conclusions: Our findings raise concern in light of the predictions for more frequent extremely warm years in Europe in the near future.
Plain language summary
The Tiger mosquito can transmit the dengue and chikungunya viruses to humans, which cause disease. In 2023, unusually warm temperatures were seen in Rome. We compared the abundance of the Tiger Mosquito between 2012 and 2023 in Rome. We used a mathematical model to estimate that there was a higher mosquito density in 2023, resulting in a longer duration of potential risk of infection of people with dengue and chikungunya viruses and a greater number of urban sites at which infection could occur. Our findings provide evidence of an increasing risk of transmission of these two viruses in Mediterranean urban areas, underscoring the critical importance of timely case detection and rapid mosquito control responses to prevent potential outbreaks in urbanised settings.
© 2025. The Author(s).
Conflict of interest statement
Competing interests: The authors declare no competing interests.
Figures


Similar articles
-
Aedes albopictus Is Rapidly Invading Its Climatic Niche in France: Wider Implications for Biting Nuisance and Arbovirus Control in Western Europe.Glob Chang Biol. 2025 Aug;31(8):e70414. doi: 10.1111/gcb.70414. Glob Chang Biol. 2025. PMID: 40831276 Free PMC article.
-
Assessing the spatio-temporal risk of Aedes-borne arboviral diseases in non-endemic regions: The case of Northern Spain.PLoS Negl Trop Dis. 2025 Jul 28;19(7):e0013325. doi: 10.1371/journal.pntd.0013325. eCollection 2025 Jul. PLoS Negl Trop Dis. 2025. PMID: 40720537 Free PMC article.
-
Indoor residual spraying for preventing malaria in communities using insecticide-treated nets.Cochrane Database Syst Rev. 2022 Jan 17;1(1):CD012688. doi: 10.1002/14651858.CD012688.pub3. Cochrane Database Syst Rev. 2022. PMID: 35038163 Free PMC article.
-
Immunogenicity and seroefficacy of pneumococcal conjugate vaccines: a systematic review and network meta-analysis.Health Technol Assess. 2024 Jul;28(34):1-109. doi: 10.3310/YWHA3079. Health Technol Assess. 2024. PMID: 39046101 Free PMC article.
-
Comparison of Two Modern Survival Prediction Tools, SORG-MLA and METSSS, in Patients With Symptomatic Long-bone Metastases Who Underwent Local Treatment With Surgery Followed by Radiotherapy and With Radiotherapy Alone.Clin Orthop Relat Res. 2024 Dec 1;482(12):2193-2208. doi: 10.1097/CORR.0000000000003185. Epub 2024 Jul 23. Clin Orthop Relat Res. 2024. PMID: 39051924
References
-
- European Centre for Disease Prevention and Control and European Food Safety Authority. Mosquito maps. Stockholm: ECDC; 2024. Accessed March 2025. Available from: https://ecdc.europa.eu/en/disease-vectors/surveillance-and-disease-data/...
-
- European Centre for Disease Prevention and Control. Worsening spread of mosquito-borne disease outbreaks in EU/EEA, according to latest ECDC figures. Accessed March 2025. Available from: https://www.ecdc.europa.eu/en/news-events/worsening-spread-mosquito-born... (2024).
-
- World Health Organization (21 December 2023). Disease Outbreak News; Dengue – Global situation. Accessed March 2025. Available at: https://www.who.int/emergencies/disease-outbreak-news/item/2023-DON498
-
- Anagnostopoulos, A. & Fehr, J. Rebound and steep increase of international travel after the COVID-19 pandemic: where are we going from here? J. Travel Med.31, 1–3 (2024). - PubMed
Grants and funding
- Bando Ricerca 2022 - Progetti di Ricerca Medi n. RM12218148E7F756/Sapienza Università di Roma (Sapienza University of Rome)
- Bando Ricerca 2021 - Progetti di Ricerca Grandi n. RG12117A8A142D4D/Sapienza Università di Roma (Sapienza University of Rome)
- Bando Ricerca 2021 - Progetti di Ricerca Grandi n. RG12117A8A142D4D/Sapienza Università di Roma (Sapienza University of Rome)
- Bando Ricerca 2022 - Progetti di Ricerca Medi n. RM12218148E7F756/Sapienza Università di Roma (Sapienza University of Rome)
- Bando Ricerca 2022 - Progetti di Ricerca Medi n. RM12218148E7F756/Sapienza Università di Roma (Sapienza University of Rome)
LinkOut - more resources
Full Text Sources

