. 2025 Jul;643(8074):1271-1280.
doi: 10.1038/s41586-025-09304-4. Epub 2025 Jul 23.

Mechanical underwater adhesive devices for soft substrates

Affiliations

Mechanical underwater adhesive devices for soft substrates

Ziliang Kang et al. Nature. 2025 Jul.

Abstract

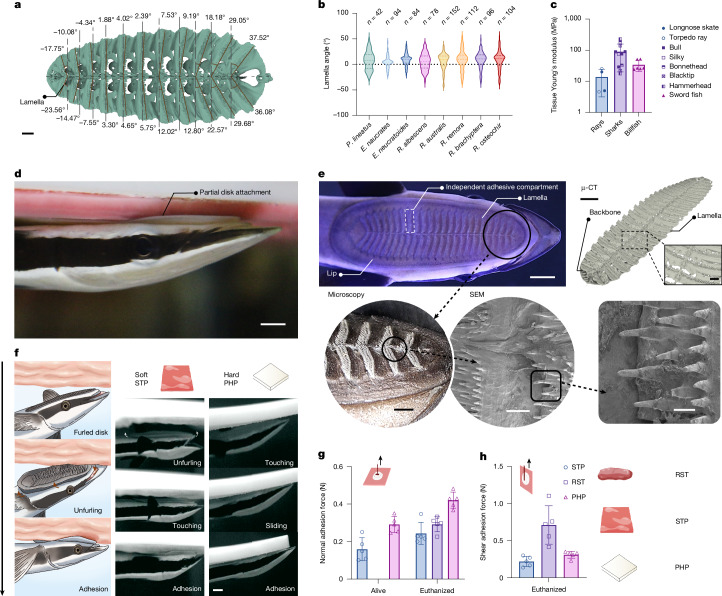
Achieving long-term underwater adhesion to dynamic, regenerating soft substrates that undergo extreme fluctuations in pH and moisture remains a major unresolved challenge, with far-reaching implications for healthcare, manufacturing, robotics and marine applications1-16. Here, inspired by remoras-fish equipped with specialized adhesive discs-we developed the Mechanical Underwater Soft Adhesion System (MUSAS). Through detailed anatomical, behavioural, physical and biomimetic investigations of remora adhesion on soft substrates, we uncovered the key physical principles and evolutionary adaptations underlying their robust attachment. These insights guided the design of MUSAS, which shows extraordinary versatility, adhering securely to a wide range of soft substrates with varying roughness, stiffness and structural integrity. MUSAS achieves an adhesion-force-to-weight ratio of up to 1,391-fold and maintains performance under extreme pH and moisture conditions. We demonstrate its utility across highly translational models, including in vitro, ex vivo and in vivo settings, enabling applications such as ultraminiaturized aquatic kinetic temperature sensors, non-invasive gastroesophageal reflux monitoring, long-acting antiretroviral drug delivery and messenger RNA administration via the gastrointestinal tract.


Conflict of interest statement

Competing interests: Z.K., G.T., A.R.K., M.Z. and Y.C. are co-inventors on a patent application describing the system reported: US Provisional Application No. 63/702,561. Complete details of all relationships for profit and not for profit for G.T. can found at https://www.dropbox.com/sh/szi7vnr4a2ajb56/AABs5N5i0q9AfT1IqIJAE-T5a?dl=0 . The other authors declare no competing interests.

Figures

Fig. 1
Fig. 1. Remoras adhere to various soft substrates.
a, Representative measurement of lamella orientation of P. lineatus. Scale bar, 1 mm. b, Remora species exhibit distinct lamella orientation distributions, mainly unimodal (for example, R. australis, R. brachyptera and R. osteochir), bimodal (for example, E. neucratoides and P. lineatus) and non-dominant (R. albescens). The dashed and dotted lines represent the median and the Q1 and Q3 quartiles, respectively (see Extended Data Fig. 1 for measurement). c, Host tissue stiffness of representative remora species: rays (R. albescens hosts, n = 4 statistics),, sharks (E. neucratoides hosts, n = 11 statistics), and billfish (R. brachyptera hosts, n = 6 samples; see Supplementary Fig. 1 for details). The error bars represent mean ± s.d. d, Firm adhesion achieved as a live remora (E. naucrates) established only partial contact of its adhesive disc to an STP). Scale bar, 5 mm. e, Anatomy of a studied remora (E. naucrates) adhesive disc via high-resolution camera (scale bar, 5 mm), micro-computed tomography (μ-CT; scale bars, 5 mm (left), 500 µm (right)), microscopy (scale bar, 1 mm; n = 3 E. naucrates), and scanning electron microscopy (SEM; 300 µm (left), 100 µm (right); n = 3 E. naucrates). f, Distinct remora adhesion behaviours on hard and soft substrates. Left: illustration of remora’s adhesion to soft substrates via disc unfurling and mechanical interlocking for multicompartmental adhesion. Middle: high-speed image of remora’s adhesion to STP by unfurling its adhesive disc. Right: remora’s adhesion to polypropylene hard plate (PHP) via sliding and friction. Arrows (left and middle) indicate unfurling (also see Supplementary Video 1). Scale bar, 5 mm. g,h, Remora’s adhesion performance to soft and hard substrates under normal (g; n = 5 independent experiments) and shear (h; n = 5 independent experiments) directions. The error bars represent mean ± s.d. (top left insets in g,h illustrate the normal and shear adhesion test setups, with arrows indicating the direction of the force applied to the adhesion disks (white); see Supplementary Fig. 2 for details). RST, real pig stomach tissue; STP, stomach tissue phantom; PHP, polypropylene hard plate.
Fig. 2
Fig. 2. Understanding remora’s adhesion to soft substrates through biomimicry.
a, Modelling remora adhesive disc mimicries contacting stomach tissue: a benchmark one-piece disc (left), a furled multicompartmental disc (middle) and an unfurled multicompartmental disc (right). Scale bar, 5 mm. b, Relative vacuum Vr (expelled water volume relative to theoretical maximum volume AInitial) achieved by disc mimicries post-tissue contact. c, Illustration of MUSAS delivery: (1) release, (2) adhesion and (3) safe passage. d, Schematic of the optimal MUSAS, inspired by R. albescens. Scale bar, 5 mm. e, MUSAS compacts into a size 000 capsule, with elastomeric fabrication flexibility (transparent, Ecoflex 0030; pink, Zhermack Elite Double 8). Scale bar, 1 cm. f, Active mechanical interlocking of MUSAS via SMA lamellae. Left: active lamella deformation (bottom) mimicking remora’s interlocking (top). Middle: temperature-induced SMA lamella erection. Right: modelling stress and martensite volume fraction during lamella erection. Scale bar, 1 mm. g, Designs (I–VI) tested to dissect the physico-mechanical roles of disc components, including the lamellae, multicompartment adhesive disk, backbone, disk lip curvature, and disk elastomer compatibility. h, Adhesion performance across different lip thicknesses, where Ws and We denote the lip thickness at the start and end of the disk lip, respectively. i, Contribution of disc components to adhesion. j,k, Adhesion performance (j) and shear sliding measuring retained adhesion post-plateau (k; also see Extended Data Fig. 2) of designs with various lamella orientations and row numbers, mimicking three representative remora species. It is noted that the parallel-eight-rows design (j) is the benchmark E-Curve tested in i. n = 5 devices per design were tested in hk. For h, boxes represent the median and the Q1 and Q3 quartiles, and whiskers represent the minimum and maximum. For i and j, the dashed and dotted lines represent the median and the Q1 and Q3 quartiles, respectively. For k, the error bars represent mean ± s.d. One-way (i) and two-way (j,k) analysis of variance with Šídák multiple comparison test were used to compare different designs. Statistical significance is indicated as follows: NS, non-significant, *P ≤ 0.05, **P ≤ 0.01, ***P ≤ 0.001, ****P ≤ 0.0001.
Fig. 3
Fig. 3. In vitro and ex vivo characterization of MUSAS.
a,b, Confocal microscopy images showing the blue-dyed (cyanine) fluorescent water distribution of MUSAS before (a) and after (b) adhesion, within the upper limits of planar and Z-depth detection of the confocal microscopy. Scale bar, 2.5 mm; n = 2 independent measurements. c,d, Adhesion performance of MUSAS on various soft substrates with different surface stiffness, roughness and intactness in normal (c) and shear (d) directions, where bars represent adhesion strength (n = 5 devices), and lines indicate the maximum adhesion force-to-weight ratio. The error bars represent mean ± s.d. eg, Underwater adhesion of MUSAS to various soft substrates (e; scale bars, nitrile glove 1 cm, all other substrates 2 cm; also see Supplementary Video 5), with associated scanning electron microscopy images of the surface intactness (f; scale bars, hydrogel and STP 1 µm, RST 100 µm, nitrile glove 3 µm, SEBS 10 µm, gourami 200 µm; n = 3 independent samples) and surface roughness (g; n = 2 samples; colour bars represent surface height) of tested substrates. h, Ex vivo characterization of wet and underwater adhesion of MUSAS on swine stomach tissue under varying pH, compared with prevalent solutions. n = 5 per adhesives. The dashed and dotted lines represent the median and the Q1 and Q3 quartiles, respectively. i, Ex vivo adhesion performance of MUSAS on various swine organs. n = 5 devices. The error bars represent mean ± s.d. Two-way analysis of variance with Tukey multiple comparison test was used to compare different adhesives (h). Statistical significance is indicated as follows: *P ≤ 0.05, **P ≤ 0.01, ***P ≤ 0.001, ****P ≤ 0.0001. Details of the mechanical test can be found in Methods and Supplementary Information.
Fig. 4
Fig. 4. In vivo characterization and resistance to dynamic interference of MUSAS.
a, In vivo adhesion and retention achieved by MUSAS in different parts of the GI tract in a swine model. b, Controlled retention and detachment of optimal MUSAS in the swine stomach through programmed mechanical interlocking with various lamella materials. n = 3 devices per stainless steel (ST) and superelastic nitinol (SE) lamellae-based MUSAS; n = 13 devices for shape-memory nitinol (SM) lamellae-based MUSAS. The error bars represent mean ± s.d. See Extended Data Fig. 5d,e for further information. c, X-rays of long-term retention of four MUSAS delivered in the stomach before safe passage in the GI tract. Scale bars, 5 cm (left), 1 cm (right). Numbers 1–4 denote four individual devices. d, Endoscopic picture of MUSAS residing in the stomach. Scale bar, 1 cm. e, Oral-delivered MUSAS leveraging oesophagus contraction to achieve self-adhesion. Scale bar, 1 cm. Also see Supplementary Video 7. f,g, Histology of lamella spinule penetration depth of MUSAS on swine stomach tissue, confirming MUSAS as a non-invasive microneedle platform capable of breaching mucosal barriers. f, The interaction area between MUSAS and the stomach tissue. g, The penetration sites from top to bottom, with dashed lines encircling the penetration holes of lamellae interaction. Scale bar, 5 mm. n = 2 Yorkshire pigs evaluated.
Fig. 5
Fig. 5. MUSAS for kinetic biosensing and drug delivery.
a, (i) Kinetic biosensing via ultraminiaturized, battery-free, wireless MUSAS radiofrequency identification (RFID) temperature sensor on a tilapia model. Scale bars, 1.5 cm (left), 200 µm (right). (ii) Demonstration of MUSAS adhesion to various location of tilapias. Scale bar, 1 cm. Also see Supplementary Video 8. (iii) Retention time of MUSAS on swimming tilapias. n = 3 tilapias per body location. (iv) In vivo kinetic temperature sensing of MUSAS on a swimming tilapia. Scale bar, 2 cm. Also see Supplementary Video 9. RSSI, received signal strength indicator. b, (i) Digital health monitoring of GERD with MUSAS-based impedance sensor. Scale bars, 5 mm (left), 1 mm (right). (ii) MUSAS detecting gastric reflux in a swine gastric fluid reflux model. c, (i) MUSAS-enabled sustained drug delivery of HIV PrEP CAB. Scale bar, 1 cm. (ii) In vitro release kinetics of CAB via different sustained-release matrices. n = 3 samples. The error bars represent mean ± s.d. (iii) Plasma pharmacokinetics of sustained CAB release through a 7-day study on a swine model. n = 3 Yorkshire pigs per treatment. The error bars represent mean ± s.e.m. d, (i) Luciferase mRNA delivered via MUSAS. Scale bar, 5 mm (left), 1 cm (right). (ii) In vivo imaging system detecting luminescent signal of luciferin conjugating proteins expressed through functionally transfected luciferase mRNA. Colour bars denote radiance measurements. Scale bar, 1 cm. (iii) Fluorescent immunohistochemistry to evaluate transfection of luciferase mRNA in the buccal and pharyngeal regions of a swine model. Scale bar, 400 µm. n = 3 Yorkshire pigs per treatment. Also see Extended Data Fig. 9.
Extended Data Fig. 1
Extended Data Fig. 1. Overview of host-specific adaptations in remora adhesive disc anatomy.
a, Cophylogenetic tanglegram of remora-host association, and dorsal view µ-CT scan of anatomy of remora adhesive disk across species. b, Representative measurement of lamella orientation of remora species from a dorsal view.
Extended Data Fig. 2
Extended Data Fig. 2. Adhesion performance of MUSAS with various lamella orientations and rows.
a, Photograph of unimodal parallel-angled (para), a bimodal mixture of parallel and tilted-angled (bimodal), and tilted-angled (tilt) MUSAS with 6 and 8 rows of lamella (scale bar: 5 mm). b,c, Representative measurements of normal adhesion forces of MUSAS with different lamella orientations and number of rows (n = 5 devices per design). d,e, Representative measurements of shear adhesion forces of MUSAS with various lamella orientations and number of rows; the shear sliding ratio is calculated as the time MUSAS maintains shear adhesion after reaching the maximum or plateau, relative to the total time of the shear drag test before losing adhesion (n = 5 devices per design). f,g, Representative measurements of shear sliding distance (n = 5 devices per design).
Extended Data Fig. 3
Extended Data Fig. 3. µ-CT imaging of internal volume changes in MUSAS with varying angles of lamella orientation and row numbers, adhering to soft substrates with distinct stiffness and roughness.
a, Setup of µ-CT imaging (scale bar: left, 1 cm; right, 5 mm). b, Representative image of suction marks left by MUSAS after adhesion to pig stomach tissue, demonstrating non-homogeneous substrate morphing. c,d, Relative vacuum ratio (c) and relative compression ratio (d) of different MUSAS designs adhering to representative soft substrates with distinct stiffness and roughness (n = 3 substrates, error bars represent mean ± s.d.; colour bars represent surface height). e, Representative µ-CT imaging of MUSAS with varying lamella orientation angles and row numbers, adhering to soft substrates with distinct stiffness and roughness. The red box represents the non-vacuum area AInitial or AAdhesion (scale bar: 5 mm).
Extended Data Fig. 4
Extended Data Fig. 4. Particle imaging velocimetry (PIV) assessment of MUSAS hydrodynamics with varying angle of lamella orientations and row numbers, demonstrated in instantaneous velocity fields.
a, Bottom-view fluid velocity maps reveal that fewer lamella rows result in minimal water expulsion, as seen in the 4 rows design. b,c, In terms of 8 rows design, unsubstantial angle variations incline to unidirectional water expulsion, making the performance of the 15 degree dominated design (c) nearly identical to that of the parallel-angled configuration (b). d,e, While lamella orientations dominated by 30 degree (d) and 45 degree (e) induce multidirectional water expulsion, the flow is often uneven and accompanied by large air bubble formation in specific regions. f, Notably, the tilt-dominant design with the substantial lamella angle variation exhibits superior efficiency in achieving homogeneous, multidirectional water expulsion (scale bar: 5 mm).
Extended Data Fig. 5
Extended Data Fig. 5. Representative in vitro and in vivo evaluation of adhesion and retention performance of MUSAS.
a, Representative retention performance of optimal tilt-dominant MUSAS under dynamic shaking interference in a 37 °C incubator (New Brunswick Innova 40/40 R, see Supp. Video S6 for further demonstration, scale bar: 1 cm). b, Illustration of the retention failure mode (scale bar: 1 cm). c, Dynamic interference evaluation of MUSAS retention performance with different angles of lamella orientation (n = 3 devices per design, error bars represent mean ± s.d.). d, MUSAS with radioactive imaging agents for routine X-rays monitoring (scale bar: 5 mm). e, Representative X-rays depicting retention of MUSAS with superelastic nitinol lamella and stainless steel lamella delivered in the stomach before safe passage in the GI tract (scale bars: left 5 cm, right 1 cm). f, Representative retention performance of MUSAS in the duodenum of the small intestine (SI) in a swine model, evaluated in a terminal study on the day of euthanasia (scale bars: left 5 cm, right 1 cm). g, Adhesion of MUSAS in various buccal regions for mRNA delivery (scale bar: 1 cm). h, Representative retention performance of MUSAS on different body surfaces of a tilapia model (scale bar: 2 cm).
Extended Data Fig. 6
Extended Data Fig. 6. pH-responsive coating enabled programmable targeted delivery of MUSAS to the small intestine.
a, In vitro demonstration of the prolonged stability of MUSAS encapsulation in simulated gastric fluid, dip-coated with the pH-dependent copolymer Eudragit S100 (scale bars: left, 5 mm; right, 1 cm). b,c, In vitro demonstration of the programmable controlled release of MUSAS in a simulated intestinal environment, dip-coated with different concentrations of the copolymer Eudragit S100 (scale bars: 1 cm). d, In vivo demonstration of programmable targeted delivery of MUSAS to the small intestine in a swine model, including safe gastric emptying in the stomach from 0 to 30 min and timely deployment in the small intestine from 35 mins to 50 mins (scale bars: 5 mm).
Extended Data Fig. 7
Extended Data Fig. 7. Design, simulation and in vitro characterization of RFID temperature sensor.
a, Schematic of the proposed RFID temperature sensor. The RFID sensor comprises a ground plane connected to a Magnus-S RFID temperature sensor chip (Axzon), a substrate, an antenna layer, and a superstrate. b, Full simulation setup in CST electromagnetic software (Simulia), featuring the RFID antenna encased in Ecoflex polymer and attached to a MUSAS, immersed in an underwater environment. c, Simulated S11 results for three scenarios: “no MUSAS” (RFID sensor in water without MUSAS), “no water” (RFID sensor attached to MUSAS in air), and “full setup” (complete assembly as shown in b). Measured (meas.) and simulated (sim.) impedance values are compared, showing significant overlap in both real and imaginary components, thereby validating the simulation accuracy. d, Simulated surface current distribution at the resonant frequency with a zero-degree phase. e, 3D far-field radiation pattern. f. 2D far-field radiation pattern. MUSAS, while not electrically connected to the RFID antenna, influences current distribution and causes distortion in the antenna’s backside radiation pattern. g, Comparison between the commercial Smartrac RFID temperature tag (Avery Dennison) and the MUSAS RFID temperature sensor (scale bar, 5 mm). h, Close-up view showing the positioning of the TSL 3166 reader (Technology Solution UK Ltd) and the RFID tags under in vitro test. i, Custom Faraday cage setup for the in vitro test, including the S3SensorTagReader app installed on an Android smartphone for collecting temperature and received signal strength indicator (RSSI) data. j, In vitro underwater temperature reading of MUSAS RFID tag, compared to a commercial sensor (g, Avery Dennison).
Extended Data Fig. 8
Extended Data Fig. 8. In vitro and in vivo validation of MUSAS-based impedance sensor for GERD monitoring.
a, In vitro resistive (real, Re) part and reactive (imaginary, Im) impedance for fluid pH differentiation (n = 5 independent measurements, error bars represent mean ± s.d.). b, In vivo differentiation of air inhalation, water, and gastric fluid (GF) consumption via MUSAS-based impedance sensor in the swine oesophagus (n = 5 independent measurements, error bars represent mean ± s.d.).
Extended Data Fig. 9
Extended Data Fig. 9. Extended in vitro and in vivo characterization of MUSAS-enabled mRNA delivery.
a, Ex vivo delivery of fluorescent nanoparticles via MUSAS, subcutaneous injection (SC), and pipette smearing, compared to negative control on oesophagus tissue (scale bar: 200 µm). b, Bioavailability of fluorescent nanoparticles (n = 3 samples per treatments, error bars represent mean ± s.d.). c, In vitro studies of mRNA transfection efficacy with different preparation methods of LNPs (unfrozen, frozen and thawed without sucrose, frozen and thawed with sucrose) for delivery to human oral epithelial cells (n = 4 samples per formulation, error bars represent mean ± s.d.). d, Time course of the IVIS radiance signal to evaluate transfection of luciferase in the buccal and pharyngeal regions of a swine model. e, In vivo trial 3 of delivering luciferase mRNA to the buccal region (scale bar: 1 cm; colour bars denote radiance measurements; see Fig. 5 for trial 1 and trial 2). Observing substantial variance differences between groups, Brown-Forsythe and Welch ANOVA with Dunnett’s T3 multiple comparison test (b) to compare different treatments and unpaired t-test with Welch’s correction (c) to compare different formulations were used, statistical significance was indicated as follows: non-significant (ns), p ≤ 0.05 (*), p ≤ 0.01 (**), p ≤ 0.001 (***).
Extended Data Fig. 10
Extended Data Fig. 10. In vivo biocompatibility evaluation of MUSAS in a swine model.
a, Illustration of tattooing adhesion sites in a swine model (scale bar: 5 mm). b, Detached MUSAS retrieved from a pig stomach after euthanasia, demonstrating thorough lubrication and accumulation of stomach contents and mucoid materials for safe passage (scale bar: 5 mm). c, Representative pig weight measurements show normal weight gain during MUSAS residence in the stomach (n = 4 devices delivered per retention study). dh, Histopathology of H&E stained the gastrointestinal tract showing no damage from MUSAS adhesion and passage that causes haemorrhage, inflammation or indication of tissue repair (fibrosis), including d, stomach. MUSAS adhesion and adjacent internal control sites, collected after 3 and 7 days of MUSAS residence (scale bar: 100 µm, n = 9 Yorkshire pigs evaluated). e, Small intestine and colon, collected after MUSAS residence in the stomach and safe passage through the GI tract (scale bars: small intestine, 200 µm; colon, 100 µm, n = 4 Yorkshire pigs evaluated). f, Oesophagus, adhesion and adjacent internal control sites, collected 1 day after adhesion (scale bar: 200 µm, n = 3 Yorkshire pigs evaluated). g,h, Buccal tissue and pharynx, adhesion and adjacent internal control sites, collected 1 day after mRNA delivery (scale bar: 100 µm, n = 3 Yorkshire pigs evaluated).

References

    1. Rich, S. I., Wood, R. J. & Majidi, C. Untethered soft robotics. Nat. Electron.1, 102–112 (2018).
    1. Martinez, R. V. et al. Robotic tentacles with three-dimensional mobility based on flexible elastomers. Adv. Mater.25, 205–212 (2013). - PubMed
    1. Fan, H. & Gong, J. P. Bioinspired underwater adhesives. Adv. Mater.33, 2102983 (2021). - PubMed
    1. Soltannia, B. & Sameoto, D. Strong, reversible underwater adhesion via gecko-inspired hydrophobic fibers. ACS Appl. Mater. Interfaces6, 21995–22003 (2014). - PubMed
    1. Wang, Y. et al. A biorobotic adhesive disc for underwater hitchhiking inspired by the remora suckerfish. Sci. Robot.2, eaan8072 (2017). - PubMed

LinkOut - more resources