. 2025 Sep;645(8079):208-217.
doi: 10.1038/s41586-025-09280-9. Epub 2025 Jul 23.

Deciphering phenylalanine-derived salicylic acid biosynthesis in plants

Affiliations

Deciphering phenylalanine-derived salicylic acid biosynthesis in plants

Yukang Wang et al. Nature. 2025 Sep.

Abstract

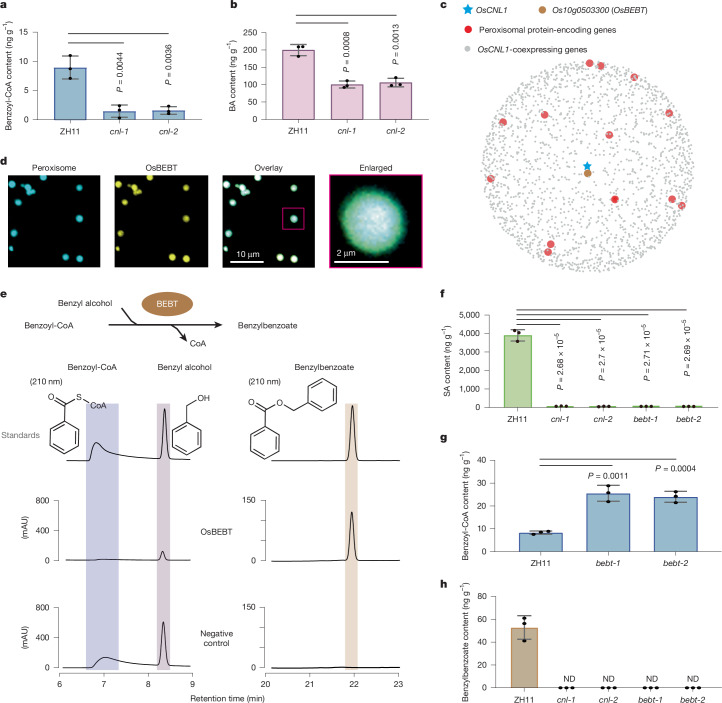
Salicylic acid (SA) is a ubiquitous plant hormone with a long history in human civilization1,2. Because of the central role of SA in orchestrating plant pathogen defence, understanding SA biosynthesis is fundamental to plant immunity research and crop improvement. Isochorismate-derived SA biosynthesis has been well defined in Arabidopsis. However, increasing evidence suggests a crucial function for phenylalanine-derived SA biosynthesis in many other plant species1. Here we reveal the phenylalanine-derived SA biosynthetic pathway in rice by identifying three dedicated enzymes - peroxisomal benzoyl-CoA:benzyl alcohol benzoyltransferase (BEBT), the endoplasmic reticulum-associated cytochrome P450 enzyme benzylbenzoate hydroxylase (BBH), and cytosolic benzylsalicylate esterase (BSE) that sequentially convert benzoyl-CoA to benzylbenzoate, benzylsalicylate and SA. The pathogen-induced gene expression pattern and SA biosynthetic functions of this triple-enzyme module are conserved in diverse plants. This work fills a major knowledge gap in the biosynthesis of a key plant defence hormone, establishing a foundation for new strategies to create disease-resistant crops.


Conflict of interest statement

Competing interests: The authors declare no competing interests.

Figures

Fig. 1
Fig. 1. Peroxisomal OsBEBT converts benzoyl-CoA to benzylbenzoate.
a,b, Quantification of benzoyl-CoA (a) and BA (b) in leaves from two-week-old wild-type (ZH11) and cnl mutant rice by liquid chromatography–tandem mass spectrometry (LC–MS/MS) with multiple reaction monitoring (MRM). Values were normalized to fresh weight. Data are mean ± s.d. (n = 3 biologically independent samples). Statistical significance was determined by two-tailed Student’s t-tests. c, Gene co-expression analysis to identify peroxisomal protein-encoding genes that are highly co-expressed with OsCNL1. The plot shows the top 2,000 genes that are co-expressed with OsCNL1, each represented as a dot (data source: ATTED-II; https://atted.jp/). The dot-to-pentagram distance scales inversely with bait gene co-expression strength. d, Subcellular localization of YFP–OsBEBT. Confocal microscopy images show the co-localization of YFP–OsBEBT and the peroxisome marker CFP–SKL in N. benthamiana leaf epidermis. The region outlined in magenta is enlarged and displayed on the right. e, High-performance liquid chromatography (HPLC) analysis of purified recombinant OsBEBT proteins incubated with benzoyl-CoA and benzyl alcohol in enzymatic reactions. Heat-inactivated OsBEBT served as the negative control. Chromatographs of absorbance at wavelength 210 nm indicate substrates and products. fh, Metabolite analysis of leaves from two-week-old wild-type (ZH11) and bebt and cnl mutant rice. SA (f), benzoyl-CoA (g) and benzylbenzoate (h) were quantified by LC–MS/MS with MRM and normalized to fresh weight. Data are mean ± s.d. (n = 3 biologically independent samples). Statistical significance was determined by two-tailed Student’s t-tests. ND, not determined. Source data
Fig. 2
Fig. 2. BA is not the direct hydroxylation precursor for SA.
a, BA content in leaves of two-week-old wild-type (ZH11) and bebt mutant rice, measured by LC–MS/MS with MRM and normalized to fresh weight. Data are mean ± s.d. (n = 3 biologically independent samples). Statistical significance was determined by two-tailed Student’s t-tests. b, SA accumulation in leaves of five-day-old ZH11 and bebt mutant rice fed with or without BA. SA content was analysed by LC–MS/MS with MRM and normalized to fresh weight. Data are mean ± s.d. (n = 3 biologically independent samples). Statistical significance was determined by one-way ANOVA with post hoc Tukey honest significant difference (HSD) test. ce, Metabolic flux analysis using deuterium-labelled BA in leaves from five-day-old ZH11 and bebt mutant rice. Metabolites were extracted from equal fresh weights of leaf tissue and analysed by LC–MS/MS with MRM. Signal intensities of labelled benzoyl-CoA (c), benzylbenzoate (d) and SA (e) are presented as normalized peak areas. Data are mean ± s.d. (n = 3 biologically independent samples). Statistical significance was determined by two-tailed Student’s t-tests. (f) Representative LC–MS chromatograms of deuterium-labelled metabolites detected by MRM. Transitions monitored include: +MRM (877.2→370.0) for deuterium-labelled benzoyl-CoA, +MRM (223.1→96.1) for deuterium-labelled benzylbenzoate and −MRM (141.0→97.0) for deuterium-labelled SA. Peak intensities relative to the highest signal for each compound are shown. cf, Asterisks indicate deuterium-labelled metabolites; + and − denote positive and negative ionization modes, respectively. g, Proposed metabolic pathway showing that BA is not directly hydroxylated to SA. Cinnamoyl-CoA is first converted through β-oxidation to benzoyl-CoA and then to benzylbenzoate, the proposed precursor of SA biosynthesis. Source data
Fig. 3
Fig. 3. The endoplasmic reticulum-localized OsBBH hydroxylates benzylbenzoate.
a, Co-expression network analysis identifying CYP genes co-expressed with OsCNL1. b, Subcellular localization of YFP–OsBBH. Confocal microscopy images show the co-localization of YFP–OsBBH and the endoplasmic reticulum (ER) marker (ER-rk) in N. benthamiana leaf epidermis. The region outlined in magenta is enlarged and displayed on the right. c,d, Quantification of SA (c) and benzylbenzoate (d) in leaves from two-week-old rice. Data are mean ± s.d. (n = 3 biologically independent samples). Statistical significance was determined by two-tailed Student’s t-tests. e, SA contents in five-day-old rice bbh mutants fed with BA or benzylbenzoate. Data are mean ± s.d. (n = 3 biologically independent samples). Statistical significance was determined by one-way ANOVA with post hoc Tukey HSD test. f,g, Functional characterization of OsBBH in N. benthamiana. Leaves transiently expressing OsBBH or mVenus (control) were treated with benzylbenzoate. f, Gas chromatography–mass spectrometry (GC–MS) analysis showing mass spectra of benzylbenzoate and benzylsalicylate compared to authentic standards. Enlarged chromatograms display m/z = 104 with phenethyl phenylacetate as internal standard (indicated by arrow). TIC, total ion chromatogram. g, Benzylsalicylate was quantified using extracted ion chromatograms (EIC; m/z = 228) normalized to internal standard (EIC m/z = 104), and the production was normalized to fresh weight of N. benthamiana leaves. Data are mean ± s.e.m. (n = 5 independent experiments). Statistical significance was determined by two-tailed Student’s t-tests. h, Quantification of benzylsalicylate in leaves from two-week-old wild-type and bbh mutant rice. Data are mean ± s.d. (n = 3 biologically independent samples). i,j, SA content of five-day-old rice bbh (i), cnl and bebt (j) mutants fed with benzylsalicylate. Data are mean ± s.d. (n = 3 biologically independent samples). Statistical significance was determined by one-way ANOVA with post hoc Tukey HSD test. In ce and hj, metabolites were analysed by LC–MS/MS with MRM and normalized to fresh weight. Source data
Fig. 4
Fig. 4. OsBSE hydrolyses benzylsalicylate to release SA.
a, Gene co-expression network analysis identifying putative esterase-encoding genes co-expressed with OsCNL1. b, Confocal microscopy images show co-localization of YFP–OsBSE and cytosolic CFP in N. benthamiana leaf epidermis. Scale bar, 30 μm. c, In vitro enzymatic activity analysis of OsBSE. HPLC chromatograms (absorbance at 210 nm) show substrate consumption and product formation when purified recombinant OsBSE was incubated with benzylsalicylate. Heat-inactivated enzyme served as the control. df, Metabolite analysis of leaves from two-week-old wild-type ZH11 and bse rice. SA (d), benzylbenzoate (e) and benzylsalicylate (f) were quantified by LC–MS/MS with MRM and normalized to fresh weight. Data are mean ± s.d. (n = 3 biologically independent samples). Statistical significance was determined by two-tailed Student’s t-tests. g, Metabolic tracking using deuterium-labelled BA in five-day-old rice leaves. Metabolites from equal-weight leaf tissue were analysed by LC–MS/MS with MRM. Left, representative LC–MS chromatograms of deuterium-labelled metabolites. Peak intensities are shown relative to the highest signal for each compound. Right, peak area quantification for labelled benzylsalicylate and SA. Data are mean ± s.d. (n = 3 biologically independent samples). Statistical significance was determined by one-way ANOVA with post hoc Tukey HSD test. h, Reconstitution of the final two steps of SA biosynthesis in N. benthamiana. Leaves transiently expressing OsBBH, OsBSE, their combination or mVenus (control) were fed with benzylbenzoate, followed by metabolite extraction. Benzylsalicylate was analysed by GC–MS (EIC, m/z = 228) and SA by LC–MS/MS with MRM. Metabolite levels were normalized to fresh weight. Data are mean ± s.d. (n = 3 independent experiments). Statistical significance was determined by Welch’s ANOVA followed by Games–Howell post hoc tests. Asterisks indicate deuterium-labelled metabolites; + and − denote positive and negative ionization modes, respectively. MRM transition parameters are indicated above chromatograms. Source data
Fig. 5
Fig. 5. The BEBT–BBH–BSE module is conserved in plant SA biosynthesis.
a, Working model of phenylalanine-derived SA biosynthesis in rice, highlighting the sequential action of BEBT, BBH and BSE enzymes. bd, Disease resistance analysis of rice mutants following M. oryzae (strain RB22) infection. Shown are representative images of disease lesions. Scale bars, 1 mm (b), quantification of lesion length using ImageJ (c) and pathogen growth assessment using DNA-based quantitative PCR (qPCR) by calculating the threshold cycle value of MoPot2 relative to the rice ubiquitin gene (OsUBIQUITIN) (d). Data are mean ± s.d. (n = 3 biologically independent samples). In c,d, statistical significance was determined by two-tailed Student’s t-tests. **P < 0.01. e,f, SA accumulation in 14-day-old rice mutants. Data are mean ± s.d. (n = 3 biologically independent samples). g, OsICS expression analysis in 14-day-old rice mutants using qPCR with reverse transcription (RT–qPCR). Data are mean ± s.d. (n = 3 biologically independent samples). h, SA quantification in 30-day-old Arabidopsis mutants with or without Pseudomonas syringae DC3000 infection. Data are mean ± s.d. (n = 3 biologically independent samples). ik, SA levels in VIGS-silenced plants following pathogen infection. Plants were individually silenced for BEBT, BBH or BSE homologues using VIGS. SA was quantified in cotton infected with Verticillium dahliae V991 (i), tomato infected with P. syringae DC3000 (j) and wheat infected with Fusarium graminearum (k). Data are mean ± s.d. (control: n = 3 biologically independent samples; VIGS-treated: n = 6 biologically independent samples). In e,f,hk, SA content was analysed by LC–MS/MS with MRM and normalized to fresh weight. In eg,hk, statistical significance was determined by one-way ANOVA with post hoc Tukey HSD test. In eg, different letters indicate significant differences (P < 0.05). Source data
Extended Data Fig. 1
Extended Data Fig. 1. Current understanding of plant SA biosynthetic pathways.
Schematics of the two established SA biosynthetic routes: the isochorismate synthase (ICS) pathway (left) and the phenylalanine ammonia-lyase (PAL) pathway (right),,–. Unknown steps in SA biosynthesis are marked with question marks. Related metabolic pathways sharing common precursors and enzymes are shown in grey.
Extended Data Fig. 2
Extended Data Fig. 2. Summary of studies on SA biosynthesis in different plant species.
(a) Heavy isotope labeling experimental evidence and conclusions of phenylalanine-derived SA biosynthesis,,–. (b) Inhibitor-based experimental evidence and conclusions of phenylalanine-derived SA biosynthesis,,,–. (c) Summary of genetic studies examining the contribution of PAL and β-oxidation enzymes to SA biosynthesis in various plant species,,,,,.
Extended Data Fig. 3
Extended Data Fig. 3. Additional analysis of OsBEBT.
(a) Sequence alignment of rice OsBEBT and other plant BEBT homologs. The amino acid sequence of rice OsBEBT was aligned with those of the putative orthologous proteins from other species, using the ClustalW sequence alignment program in MEGA7. Identical amino acids are highlighted in black, and similar amino acids are highlighted in gray. The conserved HXXXD and DFGWG motifs of the BAHD acyltransferase family are marked with yellow and pink boxes, respectively. Peroxisome targeting signal type 1 (PTS1) is indicated by a green box. (b) Analysis of purified His-tagged OsBEBT and OsBSE visualized by Coomassie-stained SDS-PAGE. For gel source data, see Supplementary Fig. 1. (c) For enzyme kinetics analysis of BA-CoA, the purified OsBEBT recombinant proteins were incubated with a saturated concentration of the indicated alcohols and varied concentrations of BA-CoA. Reaction products were quantified by UHPLC, and enzyme kinetic parameters were derived by fitting the data to the Michaelis-Menten equation (n = 3 independent experiments). ND, not detected. (d) OsBEBT mutation sites in bebt. Inserted or deleted nucleotides are in red. Black box indicates exons, and light-gray boxes indicate the UTRs. (e) Developmental time course of SA accumulation in wild-type (ZH11) rice seedlings from germination to 30 days, sampled at five-day intervals. Data represent mean ± SD (n = 3 biologically independent samples). Statistical significance was determined by one-way ANOVA with post hoc Tukey HSD test. (f) SA accumulation in five-day-old rice leaves with or without benzylbenzoate treatment. Data represent mean ± SD (n = 3 biologically independent samples). Statistical significance was determined by Welch’s ANOVA followed by Games-Howell post hoc tests. For e and f, SA contents were analyzed by LC-MS/MS with MRM and normalized to fresh weight. Source data
Extended Data Fig. 4
Extended Data Fig. 4. Phylogenetic analysis of OsBEBT and OsBSE.
(a) Phylogenetic analysis of Clade-V BAHD family proteins in rice and tobacco, together with CbBEBT, PtBEBT, and PhBEBT. All the known BEBT proteins are clustered in the same clade with Os10g0503300 (OsBEBT). (b) Phylogenetic analysis of carboxyesterase (CXE) family proteins in rice and tobacco, including NtHSR203J. Among the rice proteins, Os05g0410200 is the closest to the tobacco branch containing NtHSR203J.
Extended Data Fig. 5
Extended Data Fig. 5. Characterization of OsTE1 and OsTE2.
(a) Phylogenetic analysis of rice thioesterase (TE) family proteins and Petunia hybrida TE1 and TE2. (b) Sequence alignment of rice Petunia hybrida TE1 and TE2. The amino acid sequences of these TEs were aligned using the ClustalW sequence alignment program in MEGA7. Identical amino acids are highlighted in black, and similar amino acids are highlighted in gray. Peroxisome targeting signal type 1 (PTS1) is marked with a red box. (c) Subcellular localization of YFP-TEs. Confocal images are from tobacco leaf epidermis co-expressing the YFP-TEs and the peroxisomal marker CFP-SKL. OsTE1ΔPTS1 indicates OsTE1 with its PTS1 tripeptide deleted. The magenta box enclosed area is enlarged and displayed. (d) Enzymatic characterization of OsTE proteins. Purified recombinant proteins were incubated with BA-CoA in enzymatic reactions, followed by HPLC analysis. Heat-inactivated protein served as a control. Chromatographs of absorbance at wavelength 210 nm were displayed for substrates and products. For kinetics analysis, purified recombinant proteins were incubated with varying substrate concentrations, and the product was quantified by UHPLC. Kinetic parameters were analyzed using the Michaelis-Menten equation. Data represents mean ± SD (n = 3 independent experiments). ND: not detected. (e) Mutation sites in the OsTE1 and OsTE2 genes in the mutants. Inserted nucleotides are in red. Black boxes indicate the exons, and light gray boxes indicate the UTRs. (f-j) Metabolite analysis of two-week-old wild-type and te1 te2 mutant rice leaves. Levels of SA (f), SAG (g), BA (h), benzoyl-CoA (i), and benzylbenzoate (j) were quantified by LC-MS/MS-MRM and normalized to fresh weight. Data represents mean ± SD (n = 3 biologically independent samples). Statistical significance was determined by two-tailed Student’s t-tests. Source data
Extended Data Fig. 6
Extended Data Fig. 6. Additional characterization of OsBBH.
(a) Signal peptide prediction for OsBBH using TatgetP-2.0 (https://services.healthtech.dtu.dk/services/TargetP-2.0/). (b) Subcellular localization of OsBBH. Confocal images are from N. benthamiana leaf epidermis co-expressing YFP-OsBBH and the peroxisome marker CFP-SKL. (c) Mutation sites in rice bbh mutants. Inserted nucleotides are in red. Black boxes indicate the exons, light gray boxes indicate the UTRs, and the thick black line indicates the intron. (d) Gene expression levels of OsBBH and its N. benthamiana homologs (NbBBH1 and NbBBH2) in leaves transiently expressing OsBBH or mVenus (control). Transcript levels were quantified by RT-qPCR relative to NbEF1α calculated by 2ΔCt value. Data represent mean ± SD (n = 5 biologically independent samples). (e-f) Functional characterization of NbBBH1 and NbBBH2 in N. benthamiana using transient expression. (e) Gene expression analysis of NbBBH1 and NbBBH2 in transiently transformed leaves, where transcript levels were normalized to mVenus (control) samples using the ΔΔCt method. (f) Quantification of benzylsalicylate in leaves expressing NbBBH1, NbBBH2, or mVenus following treatment with benzylbenzoate. Products were analyzed by GC-MS using peak area of benzylsalicylate (m/z = 228) normalized to internal standard phenethyl phenylacetate (m/z = 104). The benzylsalicylate content was determined using standard curves generated from authentic standards. Data represent mean ± SD (n = 3 biologically independent samples). Statistical significance was determined by two-tailed Student’s t-tests. (g-h) In vitro enzymatic assays for OsBBH. Microsomes isolated from N. benthamiana leaves expressing OsBBH or mVenus (control) were incubated with benzylbenzoate with or without NADPH. (g) GC-MS analysis is shown with extracted ion chromatograms for benzylbenzoate (m/z = 212) and benzylsalicylate (m/z = 228). Peak intensities are shown relative to the highest signal for each compound. (h) OsBBH enzyme activity measured by quantifying the benzylsalicylate produced per μg protein per minute. Data represent mean ± SD (n = 3 independent experiments). Statistical significance was determined by two-tailed Student’s t-tests. Source data
Extended Data Fig. 7
Extended Data Fig. 7. Additional characterization of OsBSE.
(a) Signal peptide prediction for OsBSE using TatgetP-2.0. (b-c) Subcellular localization analysis of OsBSE. (b) Confocal images of rice protoplasts co-expressing the YFP-BSE and the free CFP as a cytosolic marker. (c) Immunoblot analysis of cytosolic and non-cytosolic fractions from rice protoplasts expressing OsBSE, with verification using organelle protein markers. For immunoblot source data, see Supplementary Fig. 1. (d-e) Subcellular distribution of BSE activity. Crude cell extracts of rice leaves were separated into cytosolic (supernatant) and non-cytosolic (precipitate) fractions by centrifugation. In (d), each fraction containing 5 μg protein was incubated with benzylsalicylate (500 μM), and BSE activity was determined by measuring SA production rate, normalized to the highest fraction activity. Fraction purity was verified using marker enzymes alcohol dehydrogenase (ADH, cytosolic marker) and catalase (CAT, peroxisomal marker) in (d), and chlorophyll content (chloroplast marker) in (e). Data represent mean ± SD (n = 3 independent experiments). Statistical significance was determined by two-tailed Student’s t-tests. (f) For kinetics analysis, recombinant OsBSE proteins were incubated with varied concentrations of benzylsalicylate, benzylbenzoate or cinnamylbenzoate, and the corresponding products were quantified by UHPLC. Kinetic parameters were determined using the Michaelis-Menten model. Data represents mean ± SD (n = 3 independent experiments). ND, not detected. (g) Mutation sites in the OsBSE gene in the mutants. Inserted nucleotides are in red. Black box indicates the exon, and light gray boxes indicate the UTRs. (h-i) BA contents in 2-week-old bbh (h) and bse (i) rice mutants. BA was extracted from rice leaves and analyzed by LC-MS/MS-MRM. Data represent mean ± SD (n = 3 biologically independent samples). Statistical significance was determined by two-tailed Student’s t-tests. (j) SA content in N. benthamiana plants transiently expressing OsBEBT, OsBBH, or OsBSE. Leaves were separately infiltrated with Agrobacterium carrying the empty vector, 35S-OsCNL, 35S-OsBEBT, 35S-OsBBH, or 35S-OsBSE. SA content was analyzed 2 days post-infiltration. Data represent mean ± SD (n = 6 biologically independent samples). Statistical significance was determined by two-tailed Student’s t-tests. (k) SA contents in N. benthamiana leaves co-expressing OsCNL with OsBEBT, OsBBH, or OsBSE. Equal amounts of Agrobacterium carrying 35S-OsCNL were co-infiltrated with strains containing the empty vector, 35S-OsBEBT, 35S-OsBBH, or 35S-OsBSE. SA content was analyzed 2 d post-infiltration. Data represent mean ± SD (n = 6 biologically independent samples). Statistical significance was determined by two-tailed Student’s t-tests. Source data
Extended Data Fig. 8
Extended Data Fig. 8. Measurement of SA, SAG, and SGE levels in multiple plant species under different pathogen challenges.
(a) SA and SAG contents in 25-day-old bebt, bbh and bse rice mutants with or without M. oryzae (strain RB22) infection. Data represent mean ± SD (n = 3 biologically independent samples). Different letters indicate significant differences (P < 0.05) determined by one-way ANOVA with post hoc Tukey HSD test. (b) SAG and SGE contents in 30-day-old bebt, bbh, bse, and ics Arabidopsis mutants with or without Pseudomonas syringae DC3000 infection. Data represent mean ± SD (n = 3 biologically independent samples).Statistical significance was determined by one-way ANOVA with post hoc Tukey HSD test. (c) SAG content in VIGS-silenced plants following pathogen infection. Plants were individually silenced for BEBT, BBH, or BSE homologs using VIGS. Gene accessions are described in the Methods. SAG quantification was performed under both control and pathogen-infected conditions for cotton infected with Verticillium dahliae V991, tomato infected with P. syringae DC3000, and wheat infected with Fusarium graminearum. Data represents mean ± SD (control: n = 3 biologically independent samples; VIGS-treated: n = 6 biologically independent samples). Statistical significance was determined by one-way ANOVA with post hoc Tukey HSD test. (d) Representative images of 20-day-old rice mutants (bebt, bbh, and bse) showing normal growth phenotypes compared with wild type (ZH11). Scale bar: 1.5 cm. For a-c, SA, SAG and SGE were quantified by LC-MS/MS-MRM and normalized to fresh weight. Source data
Extended Data Fig. 9
Extended Data Fig. 9. Gene expression analysis of SA biosynthetic and responsive genes in mutant and gene-silenced plants.
(a) Semi-quantitative RT-PCR analysis of BEBT, BBH, and BSE homologs in Arabidopsis mutants. AtUBC9 served as the reference gene. RNA was extracted from leaves and reverse-transcribed for analysis. For gel source data, see Supplementary Fig. 1. (b) RT-qPCR analysis of the expression of BEBT, BBH, and BSE homologs in VIGS-treated tomato, wheat, and cotton plants with or without pathogen infection. Data represent mean ± SD (control: n = 3 biologically independent samples; VIGS groups: n = 6 biologically independent samples). Statistical significance was determined by one-way ANOVA with post hoc Tukey HSD test. (c) RT-qPCR analysis of the expression of PR1 in 30-day-old bebt, bbh,bse, and ics Arabidopsis mutants with or without pathogen infection. Data represent mean ± SD (n = 3 biologically independent samples). Statistical significance was determined by one-way ANOVA with post hoc Tukey HSD test. (d) RT-qPCR analysis of the expression of PR1 in VIGS-treated tomato, wheat, and cotton plants. Data represent mean ± SD (control: n = 3 biologically independent samples; VIGS groups: n = 6 biologically independent samples). Statistical significance was determined by one-way ANOVA with post hoc Tukey HSD test. Source data
Extended Data Fig. 10
Extended Data Fig. 10. Pathogen-induced expression pattern of genes involved in the two SA biosynthetic routes in diverse plants (representing 25 species from 15 orders).
In each lollipop plot, the isochorismate- and phenylalanine-derived routes are colored by green (dark to light) and red (dark to light), respectively. The top three homologous genes with the highest absolute difference relative expression level (infected vs. mock) are shown. The transcriptome data of infected and mock plants are publicly available at NCBI’s Sequence Read Archive (SRA) Browser (https://www.ncbi.nlm.nih.gov/sra). Trim Galore v 0.6.10 removed low-quality reads and adapter sequences. Clean reads were mapped to the reference genome using STAR v 2.7.10b, and featureCounts v2.0.6 was used to count reads per gene. Gene expression quantification was performed using the TPM (Transcripts Per Million) values. Source data

References

    1. Ullah, C., Chen, Y.-H., Ortega, M. A. & Tsai, C.-J. The diversity of salicylic acid biosynthesis and defense signaling in plants: knowledge gaps and future opportunities. Curr. Opin. Plant Biol.72, 102349 (2023). - PubMed
    1. Spoel, S. H. & Dong, X. Salicylic acid in plant immunity and beyond. Plant Cell36, 1451–1464 (2024). - PMC - PubMed
    1. Desborough, M. J. R. & Keeling, D. M. The aspirin story—from willow to wonder drug. Br. J. Haematol.177, 674–683 (2017). - PubMed
    1. Zou, Z. et al. Biochemical pathways of salicylic acid derived from l-phenylalanine in plants with different basal SA levels. J. Agric. Food Chem.72, 2898–2910 (2024). - PubMed
    1. Wang, Y. et al. Species- and organ-specific contribution of peroxisomal cinnamate:CoA ligases to benzoic and salicylic acid biosynthesis. Plant Cell37, koae329 (2025). - PMC - PubMed

LinkOut - more resources