. 2025 Sep;645(8080):414-422.
doi: 10.1038/s41586-025-09277-4. Epub 2025 Jul 23.

Global hotspots of mycorrhizal fungal richness are poorly protected

Collaborators, Affiliations

Global hotspots of mycorrhizal fungal richness are poorly protected

Michael E Van Nuland et al. Nature. 2025 Sep.

Abstract

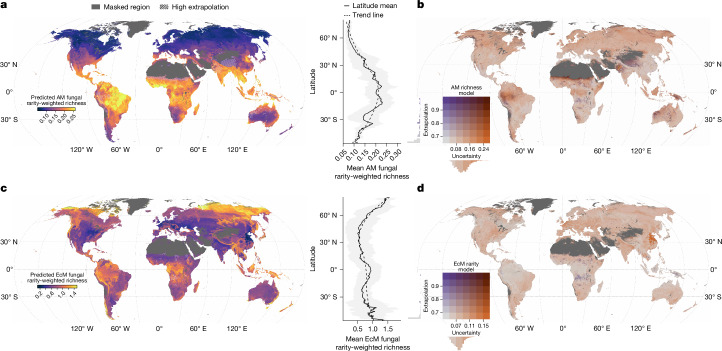
Mycorrhizal fungi are ecosystem engineers that sustain plant life and help regulate Earth's biogeochemical cycles1-3. However, in contrast to plants and animals, the global distribution of mycorrhizal fungal biodiversity is largely unknown, which limits our ability to monitor and protect key underground ecosystems4,5. Here we trained machine-learning algorithms on a global dataset of 25,000 geolocated soil samples comprising >2.8 billion fungal DNA sequences. We predicted arbuscular mycorrhizal and ectomycorrhizal fungal richness and rarity across terrestrial ecosystems. On the basis of these predictions, we generated high-resolution, global-scale maps and identified key reservoirs of highly diverse and endemic mycorrhizal communities. Intersecting protected areas with mycorrhizal hotspots indicated that less than 10% of predicted mycorrhizal richness hotspots currently exist in protected areas. Our results describe a largely hidden component of Earth's underground ecosystems and can help identify conservation priorities, set monitoring benchmarks and create specific restoration plans and land-management strategies.


Conflict of interest statement

Competing interests: E.T.K. and C.A. are the founders of the Society for the Protection of Underground Networks (SPUN), a non-governmental organization (NGO) that conducts research on mycorrhizal fungi for conservation and restoration. T.W.C. is the founder of Restor, an NGO that facilitates the global restoration movement. C.A. is the founder of Funga, an organization that facilitates the restoration of belowground fungal biodiversity. G.F. is the founding director of Fungi Foundation, an NGO that explores and educates about fungal diversity for applications and conservation. M.E.V.N., J.D.S., O.P., A.C., L.G.v.G., B.F.M., C.Q., T.L., V.M., O.D., C.M., M.S., J.W., K.G.P., C.K.C., T.V., P.K., P.B., L.T., S.A.W. and J.v.d.H. declare no competing interests.

Figures

Fig. 1
Fig. 1. Sample locations and mycorrhizal richness trends by biome.
a,b, Distribution of sites and richness estimates for AM fungi (a) and EcM fungi (b). VT were created from SSU sequences for AM fungi, and 97% similar OTUs were created from ITS sequences and assigned to EcM fungi. Mycorrhizal richness patterns across terrestrial biomes are shown in boxplots (mangroves, flooded grasslands and rock and ice biomes not shown owing to low numbers of samples in both datasets). Global distributions of estimated richness are shown in density curves above biome-level boxplots. Boxplots indicate the median (centre line), first and third quartiles (lower and upper box edges) and 1.5× the interquartile range (IQR) (box whiskers). EcM richness data are shown as square-root transformed for visualization. Richness estimates were calculated using a rarefaction and extrapolation approach that incorporates sequencing depth per sample. Points shown here are all samples that passed quality-control checks and used as training data.
Fig. 2
Fig. 2. Global predictions and latitudinal trends of mycorrhizal fungal richness.
a,c, Richness maps show the predicted number of AM fungal VT (a) and EcM fungal OTUs (c) per 100 m2 (pixels approximately 1 km2). Predicted richness values are capped at 45 VT per 100 m2 (AM) and 70 OTUs per 100 m2 (EcM) for visualization. Crosshatches are superimposed over areas that are underrepresented by the training data (highly extrapolated) where model predictions should be interpreted with caution. Plots show mean richness trends across latitude (shaded area is ±2 s.e.m.). b,d, Bivariate maps show the combination of pixel-level uncertainty (orange gradient) and extrapolation (purple gradient) of AM (b) and EcM (d) fungi richness predictions. Uncertainty is measured as the coefficient of variation across n = 100 bootstrapped model predictions. Extrapolation reflects the degree of environmental difference and geographical distance from samples in the training dataset. Histograms on the charts show the frequency of pixels in different uncertainty and extrapolation levels visualized here. Masked areas (grey) are sparsely vegetated zones and dense urban areas based on global land-cover data.
Fig. 3
Fig. 3. Global predictions and latitudinal trends of mycorrhizal fungal endemism.
a,c, Endemism maps show the predicted rarity-weighted richness of AM fungal VT (a) and EcM fungal OTUs (c) per 100 m2 (pixels approximately 1 km2). Rarity-weighted richness is a unitless metric, and predicted values are capped at 0.26 (AM) and 1.5 (EcM) for visualization. These spatial predictions reflect the simulated high-sampling scenarios to limit unequal sampling effects on rarity patterns. Crosshatches are superimposed over areas that are underrepresented by the training data (highly extrapolated) where model predictions should be interpreted with caution. Plots show mean rarity trends across latitude (shaded area is ±2 s.e.m.). b,d, Bivariate maps show the combination of pixel-level uncertainty (orange gradient) and extrapolation (purple gradient) of AM (b) and EcM (d) fungi rarity-weighted richness predictions. Uncertainty is measured as the coefficient of variation across n = 100 bootstrapped model predictions. Extrapolation reflects the degree of environmental difference and geographical distance from samples in the training dataset. Histograms on the charts show the frequency of pixels in different uncertainty and extrapolation levels visualized here. Masked areas (grey) are sparsely vegetated zones and dense urban areas based on global land-cover data.
Fig. 4
Fig. 4. Arbuscular mycorrhizal fungal hotspots and global protected areas.
Predicted richness and endemism hotspots (95th percentile of predictions) for AM fungi. Coloured areas on the map show richness hotspots (green), rarity hotspots (purple) and the overlap of richness and rarity hotspots (yellow). Black areas indicate non-hotspots. Bar graphs show the total hotspot size and percentage overlap with protected areas by biome, and grey bars reflect different IUCN management categories (I, most strictly preserved habitats; NA, unassigned category). The dashed line at 30% hotspot area protected reflects the ambitions of 30 × 30 target goals under the Kunming–Montreal Global Biodiversity Framework. ND, no data.
Fig. 5
Fig. 5. Ectomycorrhizal fungal hotspots and global protected areas.
Predicted richness and endemism hotspots (95th percentile of predictions) for EcM fungi. Coloured areas on the map show richness hotspots (green), rarity hotspots (purple) and the overlap of richness and rarity hotspots (yellow). Black areas indicate non-hotspots. Bar graphs show the total hotspot size and percentage overlap with protected areas by biome, and grey bars reflect different IUCN management categories (I, most strictly preserved habitats; NA, unassigned category). The dashed line at 30% hotspot area protected reflects the ambitions of 30 × 30 target goals under the Kunming–Montreal Global Biodiversity Framework.
Extended Data Fig. 1
Extended Data Fig. 1. Sample locations and mycorrhizal rarity trends by biome.
Distribution of sites and rarity-weighted richness (RWR) estimates for A) arbuscular mycorrhizal (AM) fungi and B) ectomycorrhizal (EcM) fungi. Mycorrhizal rarity patterns across terrestrial biomes are shown in boxplots (Mangroves, Flooded grasslands, and Rock/Ice biomes not shown due to few samples in both datasets). Global distributions of relative rarity are shown in density curves above biome-level boxplots. Boxplots indicate the median (center line), first and third quartiles (lower and upper box edges), and 1.5× IQR (box whiskers). Relative rarity data is unitless and shown as log-transformed for visualization. See Main Text for details on RWR calculation. Points shown here are all samples that passed quality control checks and used as training data for richness models.
Extended Data Fig. 2
Extended Data Fig. 2. Observed mycorrhizal richness and rarity variation with latitude.
Plots show A) AM fungi and B) EcM fungi. Points are the rarefied mycorrhizal richness values (estimated from samples) or rarity-weighted richness in relation to the latitude position where samples were collected. Curves show model fit based on a quadratic linear regression (second order polynomial).
Extended Data Fig. 3
Extended Data Fig. 3. Spatial predictions of how increased sampling could change the global distribution of mycorrhizal fungal rarity hotspots.
We built machine learning models of A) AM and B) EcM fungal rarity under two sampling scenarios. We first created empirical predictions (yellow) based on sample rarity values and the current geographic distribution of sample density (i.e., more concentrated sampling in North America, Europe, and Asia). We then built a second predictive model that simulated ‘high-sampling’ efforts (red) by setting the sampling density covariate layer to the global max value in all pixels. Mapping predicted rarity hotspots under these different scenarios shows areas that may fall out of the top 5% of global endemism centers under increased sampling (yellow), hotspot predictions that are robust to future sampling efforts (orange), and places where future sampling is likely to reveal undiscovered rarity hotspots (red).
Extended Data Fig. 4
Extended Data Fig. 4. SHapley Additive exPlanations (SHAP) value plots showing the magnitude and direction of relationships between environmental predictors and mycorrhizal richness.
For A) AM fungi and B) EcM fungi, variables at the top of the graph are the most important predictors with decreasing importance down the figure. Bar graphs (left) show mean absolute SHAP values that measure the overall magnitude of each covariate on model predictions in units of fungal richness. Beeswarm plots (right) show the directionality of SHAP values, with points left of the zero–line indicating a negative relationship between mycorrhizal richness and a given predictor. The red/blue color gradient represents fungal richness values associated with a predictor.
Extended Data Fig. 5
Extended Data Fig. 5. SHapley Additive exPlanations (SHAP) value plots showing the magnitude and direction of relationships between environmental predictors and mycorrhizal rarity.
For A) AM fungi and B) EcM fungi, variables at the top of the graph are the most important predictors with decreasing importance down the figure. Bar graphs (left) show mean absolute SHAP values that measure the overall magnitude of each covariate on model predictions in units of fungal rarity-weighted richness. Beeswarm plots (right) show the directionality of SHAP values, with points left of the zero–line indicating a negative relationship between mycorrhizal rarity and a given predictor. The red/blue color gradient represents fungal richness values associated with a predictor.
Extended Data Fig. 6
Extended Data Fig. 6. Average model uncertainty and extrapolation per biome.
Model uncertainty was measured as the coefficient of variation across bootstrapped model predictions for A) richness models and B) rarity models. C) Model extrapolation was quantified through principal component analysis of the training data (see Methods in main text). Note: only one extrapolation figure is shown for both richness and rarity models since these were built using the same geo-located sample coordinates from which our extrapolation approach is based. Points show mean, bars show standard deviation.
Extended Data Fig. 7
Extended Data Fig. 7. Maps showing geographic distribution of model uncertainty and extrapolation for mycorrhizal fungal richness models.
Model uncertainty and extrapolation shown for A) AM fungi richness and B) EcM fungi richness predictions. Brighter colors indicate areas with relatively higher coefficient of variation across bootstrapped predictions (which we define as model uncertainty), or higher extrapolation due to poor environmental and spatial representation in the richness training data.
Extended Data Fig. 8
Extended Data Fig. 8. Maps showing geographic distribution of model uncertainty and extrapolation for mycorrhizal fungal endemism models.
Model uncertainty and extrapolation shown for A) AM fungi rarity-weighted richness and B) EcM fungi rarity-weighted richness predictions. Brighter colors indicate areas with relatively higher coefficient of variation across bootstrapped predictions (which we define as model uncertainty), or higher extrapolation due to poor environmental and spatial representation in the rarity-weighted richness training data.
Extended Data Fig. 9
Extended Data Fig. 9. Predicted versus observed plots of mycorrhizal richness and rarity-weighted richness (rwr) showing the model fit to the training data.
For A) AM fungi and B) EcM fungi, the X axis represents observed data used to train the machine learning model and the Y axis shows predicted values from the model. Colors indicate the density of points in the dataset. Solid lines show a 1-1 relationship between predicted versus observed values, indicating a perfect fit and 100% predictive accuracy. The dashed line shows the actual fit between the observed and predicted values. Axes scales are log-transformed.

References

    1. Högberg, M. N. & Högberg, P. Extramatrical ectomycorrhizal mycelium contributes one-third of microbial biomass and produces, together with associated roots, half the dissolved organic carbon in a forest soil. New Phytol.154, 791–795 (2002). - PubMed
    1. van Der Heijden, M. G., Martin, F. M., Selosse, M. A. & Sanders, I. R. Mycorrhizal ecology and evolution: the past, the present, and the future. New Phytol.205, 1406–1423 (2015). - PubMed
    1. Hawkins, H. J. et al. Mycorrhizal mycelium as a global carbon pool. Curr. Biol.33, R560–R573 (2023). - PubMed
    1. Cavicchioli, R. et al. Scientists’ warning to humanity: microorganisms and climate change. Nat. Rev. Microbiol.17, 569–586 (2019). - PMC - PubMed
    1. Guerra, C. A. et al. Tracking, targeting, and conserving soil biodiversity. Science371, 239–241 (2021). - PubMed

LinkOut - more resources