. 2025 Sep;645(8081):729-736.
doi: 10.1038/s41586-025-09301-7. Epub 2025 Jul 23.

A gut sense for a microbial pattern regulates feeding

Affiliations

A gut sense for a microbial pattern regulates feeding

Winston W Liu et al. Nature. 2025 Sep.

Abstract

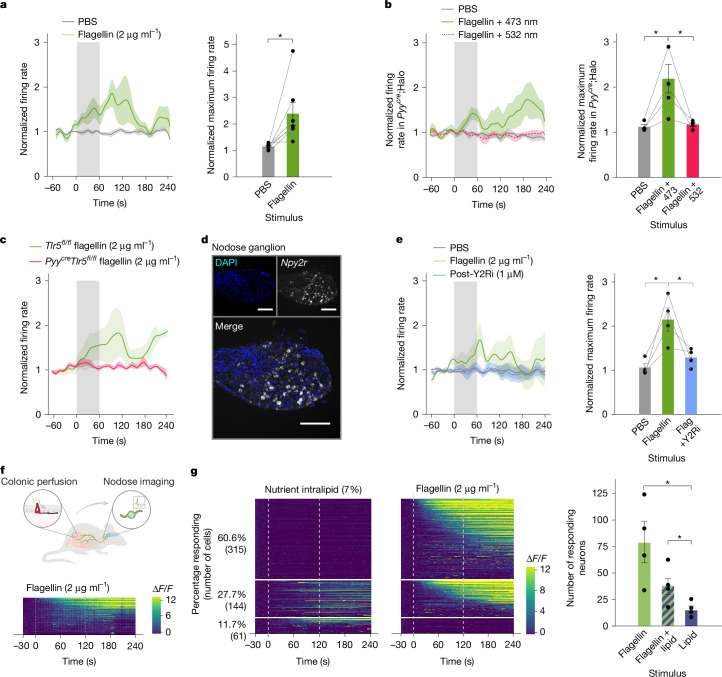
To coexist with its resident microorganisms, the host must have a sense to adjust its behaviour in response to them. In the intestine, a sense for nutrients transduced to the brain through neuroepithelial circuits guides appetitive choices1-5. However, a sense that allows the host to respond in real time to stimuli arising from resident gut microorganisms remains to be uncovered. Here we show that in the mouse colon, the ubiquitous microbial pattern flagellin-a unifying feature across phyla6-stimulates Toll-like receptor 5 (TLR5) in peptide YY (PYY)-labelled colonic neuropod cells. This stimulation leads to PYY release onto NPY2R vagal nodose neurons to regulate feeding. Mice lacking TLR5 in these cells eat more and gain more weight than controls. We found that flagellin does not act on the nerve directly. Instead, flagellin stimulates neuropod cells from the colonic lumen to reduce feeding through a gut-brain sensory neural circuit. Moreover, flagellin reduces feeding independent of immune responses, metabolic changes or the presence of gut microbiota. This sense enables the host to adjust its behaviour in response to a molecular pattern from its resident microorganisms. We call this sense at the interface of the biota and the brain the neurobiotic sense7.


Conflict of interest statement

Competing interests: D.V.B. and M.M.K. are founders and board directors of the Gastronauts Foundation, Inc, a 501(c)3 non-profit company. Some of the findings have been filed by D.V.B. as a provisional patent application. All other authors declare no competing interests.

Figures

Fig. 1
Fig. 1. The absence of microbial pattern recognition receptor TLR5 in colonic PYY-labelled cells increases food intake.
a, Mouse colon with GFP-labelled PYY-labelled cells was rolled longitudinally (proximal colon in the centre); representative of n = 3 mice. Inset: magnified view of the outlined area showing a single PYY–GFP cell with apical process reaching into the lumen and neuropod reaching towards the base of the crypt. DAPI, 4′,6-diamidino-2-phenylindole. Scale bars, 10 μm. b, Volcano plot of microbial pattern recognition receptor gene expression in epithelial PYY–GFP and non-GFP cells by RNA sequencing. Compared to non-GFP cells, PYY–GFP cells are enriched for the pattern recognition receptor gene Tlr5 (n = 6 mice; adjusted P < 0.01 by DESeq2 with two-tailed t-test). c, Fluorescence in situ hybridization of Tlr5 in PYY–GFP cells. Error bars represent s.e.m. Left: regional expression of Tlr5 in PYY–GFP cells (n = 3 mice, each dot represents 50 cells). n.d., not detected (no cells expressing Tlr5). Dist. distal; Duo., duodenum; Jej., jejunum; Ile., ileum; Prox., proximal. Right, PYY-labelled cell (green) expressing Tlr5 (red) in the distal colon; representative of n = 3 mice. Scale bar, 10 μm. White dashed line represents PYY-labelled cell outline. d, Left, genetic deletion of Tlr5 exclusively in PYY-labelled cells causes increased weight gain in male and female mice (males (M) Pyycre;Tlr5fl/fl: n = 7 mice, starting weight = 5.78 g ± 0.61; Tlr5fl/fl littermate controls: n = 15 mice, starting weight = 14.28 g ± 0.71; females (F) Pyycre;Tlr5fl/fl: n = 6 mice, starting weight = 15.04 g ± 0.53; Tlr5fl/fl littermate controls: n = 11 mice, starting weight = 14.16 g ± 0.39; *P < 0.05 genotype–time interaction by repeated-measures analysis of variance (ANOVA) with post hoc Tukey honestly significant difference (HSD). Error bars represent s.e.m. Right, meal duration in females and meal size in males and females significantly increased in Pyycre;Tlr5fl/fl mice (Tlr5fl/fl males: n = 413 meals, n = 6 mice; 5Pyycre;Tlr5fl/fl males: n = 612 meals, n = 9 mice; Tlr5fl/fl females: n = 399 meals, n = 8 mice; Pyycre;Tlr5fl/fl females: n = 468 meals, n = 9 mice; n = 2 independent experiments; *P < 0.05 by two-way ANOVA with post hoc Tukey HSD; P < 0.05 main effect of genotype and sex for meal size and duration with P > 0.05 genotype–sex interaction). No changes observed in meal frequency (see Extended Data Fig. 5 for further analyses). Box plots represent interquartile range; white lines indicate median; whiskers extend to the furthest point above the third quartile or below the first quartile within 1.5× the interquartile range.
Fig. 2
Fig. 2. PYY-labelled cells sense microbial flagellin through TLR5.
a, Relative stool flagellin concentration from Pyycre;Tlr5fl/fl mice and Tlr5fl/fl littermate controls following 16-h fast or ad libitum feeding. No differences across genotype. Feeding increased stool flagellin (n = 5 mice; *P < 0.05 by repeated-measures ANOVA with post hoc two-tailed Tukey HSD). b, Heat map (n = 6 mice; adjusted *P < 0.01 by DESeq2 with two-tailed t-tests; P values in Extended Data Fig. 1; left) and qRT–PCR (non-PYY+, n = 5 mice; PYY+, n = 6 mice; *P < 0.05 by repeated-measures ANOVA with post hoc Tukey HSD; right) of TLR gene expression in non-GFP and PYY–GFP colonic epithelial cells. c, Selected calcium responses of Pyycre;Salsa6f colonic cells to poly(I:C) (19%, n = 63 cells, n = 4 mice), lipopolysaccharide (LPS; 0%, n = 80 cells, n = 3 mice) and flagellin (26%, n = 121 cells, n = 5). Grey bar indicates 30-s infusion. d, Calcium responses to poly(I:C) and flagellin before (solid) and after (dashed) TLR5 inhibitor TH1020 (1 μM). e, Calcium response quantification. Only flagellin, not poly(I:C), responses were reduced (poly(I:C): n = 12 cells; flagellin: n = 9 cells; *P < 0.05 by paired, two-tailed t-test). NS, not significant. f, Colonic epithelial monolayer cultures from Pyycre;Tlr5fl/fl mice and Tlr5fl/fl littermate controls stimulated with buffer, 100 ng ml−1 flagellin and 1 μM forskolin (F) + 10 μM IBMX (I; positive control (ctrl)). PYY concentration in cell lysates and supernatants measured using enzyme-linked immunosorbent assay. Flagellin stimulated PYY release in Tlr5fl/fl but not Pyycre;Tlr5fl/fl cultures (n = 4 mice; *P < 0.05 by repeated-measures ANOVA with post hoc two-tailed Tukey HSD). g, Heat map of synaptic gene expression in non-GFP and PYY–GFP colonic cells (n = 6 mice; adjusted P < 0.01 by DESeq2 with two-tailed t-tests, P values in Extended Data Fig. 1). h, Colonic PYY–GFP tissue immunostained for PGP9.5 (red). Representative of n = 3 mice; regions quantified in Extended Data Fig. 7. Scale bars, 10 μm. i, Left: vagal responses to intracolonic PBS and stimulation by a 473-nm and 532-nm light-emitting diode (LED) in Pyycre;ChR2 mice (n = 3 mice). Right: quantification of peak vagal responses (n = 3 mice; *P < 0.05 by two-tailed Wilcoxon signed ranked test with non-parametric comparisons). Error bars and shading represent s.e.m.
Fig. 3
Fig. 3. PYY–vagal circuits transduce colonic flagellin.
a, Left, vagal responses to intracolonic perfusion of PBS or 2 μg ml−1 flagellin in wild-type mice (n = 7 mice). Right, quantification of peak response to flagellin (n = 7 mice; *P < 0.05 by two-tailed paired t-test). b, Left, vagal responses to intracolonic perfusion of PBS and 2 μg ml−1 flagellin with simultaneous 473-nm-LED or 532-nm-LED stimulation in Pyycre;Halo mice (n = 4 mice). Right, quantification of the peak vagal response to flagellin (n = 4 mice; *P < 0.05 by two-tailed Wilcoxon signed ranked test with non-parametric comparisons using the Wilcoxon method). c, Vagal responses to intracolonic perfusion of flagellin in Pyycre;Tlr5fl/fl mice (n = 5 mice) and Tlr5fl/fl littermate controls (n = 3 mice; for quantification, see Extended Data Fig. 8). d, Fluorescence in situ hybridization of PYY receptor Y2R (encoded by Npy2r) in a subpopulation of neurons in the vagal nodose ganglion. Representative of n = 4 ganglia. Scale bars, 10 μm. e, Left, vagal responses to intracolonic perfusion of PBS or 2 μg ml−1 flagellin before and after intraperitoneal delivery of the Y2R inhibitor (Y2Ri) BIIE-0246 (1 μM; n = 4 mice). Right, quantification of the peak vagal response to flagellin with and without the addition of Y2R inhibitor 1 μM BIIE-0246 (n = 4 mice; *P < 0.05 by Kruskal–Wallis test with non-parametric comparisons using the Wilcoxon method). f, In vivo calcium imaging of vagal nodose neurons positive for Npy2r in response to colonic perfusion of flagellin (2 µg ml−1; n = 4 mice, n = 144 neurons). A total of 43.37% of NPY2R+ cells respond to 2 µg ml−1 flagellin. g, Left, in vivo calcium imaging of vagal nodose neurons in response to colonic perfusion of either intralipid (7%) or flagellin (2 µg ml−1). n = 520 neurons, n = 4 mice. Right, number of responding neurons to each stimulus (n = 4 mice, n = 520 neurons). Grey dashed lines in the heat maps represent start and end of perfusion. Error bars and shading represent s.e.m. Graphics in f adapted with permission from ref. , AAAS.
Fig. 4
Fig. 4. PYY–vagal circuits use TLR5 and Y2R to drive changes in food intake.
Mice were fasted overnight and given an enema of either 1 μg ml−1 flagellin or PBS before receiving access to standard chow ad libitum. a,b, Tlr5fl/fl littermate control mice ate significantly less food post-flagellin enema at 20, 40 and 60 min (a), whereas Pyycre;Tlr5fl/fl mice did not (b; n = 5 mice per genotype; *P < 0.05 genotype–enema–time interaction by repeated-measures ANOVA with post hoc two-tailed Tukey HSD). c,d, In wild-type mice, PBS and flagellin enemas were performed with the addition of either 10 μM TH1020 in the enema solution (n = 8 mice; c); or intraperitoneal injection of 1 μM BIIE-0246 before enema (n = 10 mice; d). TLR5 and Y2R inhibition attenuated the reduction of food intake post-flagellin enema (P < 0.05 drug–enema–time interaction by repeated-measures ANOVA with post hoc Tukey HSD; see Extended Data Fig. 9c,d for vehicle controls). i.p., intraperitoneal. e, Crunch Master (top schematic) tracks feeding microstructure by means of audio and video recording. Black ticks (bottom) indicate biting patterns of n = 7 mice post-PBS or flagellin enema. f, Left, flagellin enema significantly delayed onset of the first three bites (black: bite 1; blue: bite 2; green: bite 3; *P < 0.0001 main effect of treatment by repeated-measures ANOVA). Right, intake (spillage-corrected) was significantly decreased over 1-h test session after flagellin enema (two-tailed unpaired t-test, *P < 0.01). Violin plots show median indicated by thick line and mean indicated by thin line. g, In wild-type germ-free mice, flagellin enema decreased food intake compared to PBS enema (n = 12 mice; *< 0.05, enema–time interaction by repeated-measures ANOVA with post hoc two-tailed Tukey HSD). Error bars represent s.e.m. h, Model for microbial pattern sensing by neuroepithelial circuits to drive behavioural change. Bacterial flagellin is detected by TLR5 in colonic PYY-labelled cells, which in turn release PYY to activate vagal neurons through Y2R. Activation of this circuit contributes to overall food intake. Graphics in h adapted with permission from ref. , AAAS.
Extended Data Fig. 1
Extended Data Fig. 1. RNASeq of Cck- and Pyy-labeled cells.
Heatmap showing expression of (a,e) neuropeptide, (b,f) nutrient sensor, and (c,g) metabolite receptor genes in non-GFP and CckGFP epithelial cells from the proximal half of the (a-d) small intestine or non-GFP and PyyGFP epithelial cells from the (e-h) ileum and colon (n ≥ 5 mice; adjusted P values by DESeq2 with two-tailed t-tests). (d,h) Table of base mean expression, fold change, and adjusted P value of Toll-like receptors between (d) CckGFP cells and non GFP cells and (h) PyyGFP cells and non-GFP cells.
Extended Data Fig. 2
Extended Data Fig. 2. Tlr5 transcripts in neuropod cells.
(a) (Left) Pyy-labeled neuropod cells per crypt: This panel shows the number of Pyy-positive cells per crypt in female and male mice. Each dot represents the average of 50 crypts analyzed. P > 0.05 by two-tailed t-test. (Right) Ileal and colonic tissues from PyyGFP mice (n = 3 mice) were evaluated for Pyy cell quantities per segment. (b) (Left) Neurod1Cre_tdTomato (red) cell with ISH labeling of Pyy, representative of n = 3 mice. (Right) Quantification of overlap between Neurod1Cre_tdTomato cells with 5HT and Pyy in the colon (n = 3 mice, each dot represents n = 50 cells). (c) (Left) Neurod1Cre_tdTomato (green) cell with ISH labeling of Tlr5 (red), representative of n = 3 mice. (Right) Regional expression of Tlr5 in Neurod1-labeled neuropod cells (n = 3 mice, each dot represents n= 50 cells). (d) (Left) Antibody-labeled serotonin (green) cell with ISH labeling of Tlr5 (red), representative of n = 3 mice. (Right) Regional expression of Tlr5 in 5HT cells (n = 3 mice, each dot represents n = 50 cells). Scale bars=10μm. Error bars represent S.E.M. e-h: Single-cell RNA sequencing (scRNAseq) analysis of whole mouse brain (Allen Institute Brain Atlas). (f,g) Cluster of Pyy-labeled cells in the medulla. (g,h) These Pyy-labeled cells do not express Tlr5. eh, adapted from ref. , Springer Nature Limited, under a Creative Commons licence CC BY 4.0.
Extended Data Fig. 3
Extended Data Fig. 3. Metabolic and immune phenotype of PyyCre_Tlr5fl/fl mice.
(a) In-situ hybridization of Tlr5 transcripts in colonic Pyy-labeled cells in PyyCre_Tlr5fl/fl mice and _Tlr5fl/fl littermates (n = 3 mice per genotype; two-tailed unpaired t-test *P < 0.05). Scale bar=10μm. Genetic deletion of Tlr5 in Pyy-labeled cells did not affect (b) oral glucose tolerance, (c) fasting blood glucose, (d) fat pad weights, (e) serum PYY or GLP-1 levels (fasted overnight, one-hour refed), (f) colon length, and (g) weight, or (h) spleen weight (P > 0.05 by ANOVA, for sample sizes see Supplementary Table 2). (i) Colonic myeloperoxidase levels (n = 6 mice per genotype) and fecal lipocalin-2 levels (n = 5 mice per genotype) across genotypes (P > 0.05 by two-tailed unpaired t-test). (j) Morpho-pathological analysis of Hematoxylin & Eosin-stained colon sections from PyyCre_Tlr5fl/fl mice and _Tlr5fl/fl control littermates. Proinflammatory lamina propria cells in both groups were within normal limits, representative of n = 3 mice. Scale bar=100μm. Comparison of colons from PyyCre_Tlr5fl/fl mice and _Tlr5fl/fl control littermates showed no change in (k) crypt depth (n = 3 mice), (l) PYY and 5-HT cell density (n = 3 mice), (m) epithelial Tlr expression (n = 6 mice), or (n) tight junction expression (n = 6 mice) (P > 0.05 by two-tailed unpaired t-test). (o) Genetic deletion of Tlr5 in Pyy-labeled cells significantly increased weight gain in males and females (males: n = 7 mice for PyyCre_Tlr5fl/fl, n = 15 mice for _Tlr5fl/fl littermate controls; females: n = 6 mice for PyyCre_Tlr5fl/fl, n = 11 mice for _Tlr5fl/fl littermate controls; *P < 0.05 genotype*time interaction per sex by rmANOVA with post-hoc two-tailed Tukey HSD). (p) 24 h food consumption was significantly higher in PyyCre_Tlr5fl/fl mice compared to _Tlr5fl/fl littermate controls (males: n = 4 mice for PyyCre_Tlr5fl/fl, n = 7 mice for _Tlr5fl/fl littermate controls; females: n = 4 mice for PyyCre_Tlr5fl/fl, n = 4 mice for _Tlr5fl/fl littermate controls; *P < 0.05, genotype main effect by ANOVA with post-hoc two-tailed Tukey HSD, no significant differences between days, intake averaged across 3 consecutive days at 21 weeks of age). Error bars represent S.E.M.
Extended Data Fig. 4
Extended Data Fig. 4. Phenotype of PyyCre_Myd88fl/fl mice.
(a) In situ hybridization validating the lack of Myd88 transcripts in colonic Pyy-labeled cells in PyyCre_Myd88fl/fl mice (n = 3, 4 mice; *P < 0.05 by two-tailed unpaired t-test). (b) Genetic deletion of Myd88 exclusively in Pyy-labeled cells caused no significant change in the relative concentration of flagellin in the stool (n = 4 mice, P > 0.05 by two-tailed unpaired t-test). PyyCre_Myd88fl/fl mice had no changes in weight gain compared to their littermate controls in both (c) females (PyyCre_Myd88fl/fl: n = 3 mice, _Myd88fl/fl: n = 4 mice; P > 0.05 by rmANOVA) and (d) males (PyyCre_Myd88fl/fl: n = 4 mice, _Myd88fl/fl: n = 7 mice; P > 0.05 by rmANOVA). (e) PyyCre_Myd88fl/fl had no changes in 24-hour food consumption averaged across 3 consecutive days (n = 4 mice; P > 0.05 by ANOVA). Error bars represent S.E.M.
Extended Data Fig. 5
Extended Data Fig. 5. Meal pattern analysis in PyyCre_Tlr5fl/fl mice.
(a) Schematic of meal pattern analysis showing that meals are defined as consumption >0.1 g with at least 10 min in between bouts. Cumulative food consumption was assessed for PyyCre_Tlr5fl/fl and _Tlr5fl/fl littermate control mice across 3 days in the TSE Phenomaster for (b) male and (c) female mice. Quantification of meals across 72 h in the dark and light cycles in males and females of (d) meal duration, (e) meal size, and (f) inter-meal interval. Box plots represent interquartile range, white lines indicate median. and (g) meal count (PyyCre_Tlr5fl/fl: n = 9 male mice and n = 9 female mice; _Tlr5fl/fl: n = 6 male mice and n = 8 female mice; *P < 0.05 genotype main effect by ANOVA with post-hoc two-tailed Tukey HSD).
Extended Data Fig. 6
Extended Data Fig. 6. Enteroendocrine cells are activated by flagellin.
(a) (Left) Selected Calcium trace from acutely dissociated Neurod1Cre_Salsa6f colonic cells demonstrating experimental paradigm, representative of n = 18 cells. Each cell was exposed to each stimulus twice, and a responder was defined as a cell that responded twice. (Right) Quantification of calcium response magnitude of flagellin responders (*P < 0.05 by rmANOVA with post-hoc two-tailed Tukey HSD). (b) Calcium traces from acutely dissociated Neurod1Cre_Salsa6f colonic cells. 9% of cells responded to 1 μg/mL PolyI:C (n = 63 cells, n = 4 mice), 3% of cells responded to 1 mg/mL lipopolysaccharide (LPS) (n = 80 cells, n = 4 mice), and 13% of cells responded to 100 ng/mL flagellin (n = 121 cells, n = 6 mice). Gray indicates 30 s infusion. (c) (Left) Immunofluorescence image showing plated colonic crypts with individual Pyy-labeled cells (green) in PyyGFP mice. Scale bar=10μm. (Middle) Stimulation of colonic crypts with cAMP activators 1 μM forskolin and 10 μM IBMX, but not 1 μg/mL PolyI:C induce PYY release (n = 6 mice). (Right) Stimulation of colonic crypts with cAMP activators 1 μM forskolin and 10 μM IBMX, and 100 ng/mL flagellin induce PYY release (n = 5 mice; *P < 0.05 by one way ANOVA with post-hoc Tukey HSD). Error bars indicate S.E.M.
Extended Data Fig. 7
Extended Data Fig. 7. Vagal neurons are contacted by Pyy-labeled cells and are activated by intracolonic stimuli.
(a) List of significantly enriched gene ontology terms related to neuronal connection in Pyy-labeled cells (n = 6 mice; adjusted *P < 0.05 by topGO analysis). (b) Table of base mean, fold change, and adjusted P value for pre-synaptic genes between PyyGFP cells and non-GFP cells (DESeq2 with two-tailed t-tests). (c) Quantification of contacts between Pyy-labeled cells and Pgp9.5 neuronal fibers in different regions of the intestine (n = 3 mice). (d) Schematic of the vagal recording technique. The cervical vagus was recorded while the entire colon was simultaneously perfused with stimulus. (e) (Left) Schematic demonstrating 473 nm light via an intracolonic light emitting diode (LED) activating the cation channel Channelrhodopsin (ChR2) and depolarizing a Pyy-labeled cell. (Right) Representative image showing expression of ChR2-tdTomato (red) in a colonic Pyy-labeled cell (green). (f) Spike raster from vagal recordings in which PBS, 2 μg/mL flagellin, or 7% intralipid was perfused into the colon, representative of n = 4 mice. Gray bar represents the perfusion interval. (g) (Left) Vagal responses to intracolonic perfusion of PBS or 7% intralipid in wild-type mice (n = 4 mice). Error bars indicate S.E.M. (Right) Quantification of peak response to intralipid (*P < 0.05 by two-tailed paired t-test). (h) (Left) Schematic demonstrating 532 nm light activating the anion channel Halorhodopsin (Halo) and hyperpolarizing a Pyy-labeled cell. (Right) Representative image showing expression of Halorhodopsin-YFP (Green) in a colonic Pyy-labeled cell (red). Scale bars=10μm. Graphics in d,e,h adapted from ref. , AAAS.
Extended Data Fig. 8
Extended Data Fig. 8. Vagal neurons neither express Tlr5 nor respond directly to flagellin.
(a) Quantification of the peak vagal response to flagellin in PyyCre_Tlr5fl/fl and _Tlr5fl/fl littermate controls (PyyCre_Tlr5fl/fl: n = 5 mice; _Tlr5fl/fl: n = 3 mice; *P < 0.05 by Kruskal Wallis test with non-parametric comparisons using the Wilcoxon method). (b) RNAseq of vagal nodose neurons showed no expression of Tlr5 (PyyGFP+ cells: n = 5 mice, PyyGFP- cells: n = 8 mice, nodose neurons: n = 8 mice; DESeq2 normalization). (c) qPCR of synaptic markers and Toll-like receptors in vagal nodose neurons (n = 3 mice). (d) In situ hybridization of Nissl (green) stained neurons of the nodose ganglion showed no expression of Tlr5 (red), representative of n = 3 mice. Scale bars=100μm. (e) Representative trace of calcium transient in acutely dissociated Neurod1Cre_Salsa6f nodose neurons showed responses in 57% of neurons to capsaicin, but not to flagellin (n = 227 neurons, n = 4 mice). (f) Secondary analysis of data from Bai et al., 2018 of the colon-projecting vagal neurons showed expression of the PYY receptor Npy2r (n = 44 cells). (g) Spatial overlay of vagal nodose neurons using tdTomato and GCaMP6s fluorescence. (h) Spatial overlay of vagal nodose neurons using compartment analysis of temporal activity by fluorescence in situ hybridization (CatFISH). (i) Representative image of CaTFISH mapping of in vivo calcium transients onto Npy2r positive neurons. Scale bars=10μm. (j) Calcium traces from vagal nodose neurons responsive to either only flagellin (2 µg/mL) (top), intralipid (7%) and flagellin (2 µg/mL) infused separately (middle), or only intralipid (7%) (bottom), representative of n = 520 neurons. Error bars and shades indicate S.E.M. f, adapted from ref. , Cell Press.
Extended Data Fig. 9
Extended Data Fig. 9. Intracolonic flagellin modulates food intake.
Mice were fasted overnight and received flagellin (1 μg/mL) or PBS enemas prior to gaining ad libitum access to standard chow for 60 min. Flagellin reduced food intake compared to PBS in (a) PyyCre mice (n = 6 mice); (b) 5-week-old mice (n = 5 mice); and 10-week-old mice (n = 5 mice; *P < 0.05, enema*time interaction by rmANOVA with post-hoc two-tailed Tukey HSD). (c) (Left) PolyI:C (1 μg/mL) enema was not sufficient to alter food intake compared to PBS enema (n = 5 mice; P < 0.05, enema*time interaction by rmANOVA with post-hoc two-tailed Tukey HSD). (Right) Effects of flagellin dissipated after 180-minutes post-enema (n = 9 mice; P > 0.05 at 180 min by post-hoc Tukey HSD). (d) Neither vehicle enema (dimethyl sulfoxide, DMSO; n = 8 mice) nor vehicle intraperitoneal injection (saline; n = 10 mice) altered feeding response to flagellin enema (P < 0.05 by two-tailed t-test. (e) Crunch Master analysis of bites for number of bites, bite time, which is the average time of a single feeding bout, and feeding time which is the number of minutes that mice engaged in feeding, did not change during the 1-hour recording session (n = 7 mice per treatment group; P > 0.05 by two-tailed unpaired t-test). Violin plots show median indicated by thick line and mean indicated by thin line. (f) Relative flagellin concentration was measured in stool collected from wildtype mice following an 18-hour fast (n = 5 mice), ad libitum feeding (n = 5 mice), or an 18-hour fast plus enema of PBS (n = 6 mice) or flagellin [1 μg/mL] (n = 6 mice). Feeding significantly increased stool flagellin, however, flagellin enema was not sufficient to rescue flagellin levels to the fed state (*P < 0.05 by rmANOVA with post-hoc two-tailed Tukey HSD). Error bars indicate S.E.M.
Extended Data Fig. 10
Extended Data Fig. 10. Flagellin enema is not sufficient to induce an immune response.
(a) Cytokine expression in the colon 1 h after enema of PBS (n = 5 mice), flagellin [1 µg/mL] (n = 6 mice), flagellin [3 µg/mL] (n = 6 mice), PolyI:C [1 µg/mL] (n = 6 mice), or intraperitoneal (i.p.) injection of PBS (n = 6 mice), flagellin [20 µg/mL] (n = 6 mice), PolyI:C [4 mg/mL] (n = 5 mice), LPS [500 µg/mL] (n = 6 mice) (*P < 0.05 significance from PBS enema group by non-parametric two-tailed Wilcoxon each pair test). (b) Cytokine expression in the spleen 1 h after enema of PBS (n = 6 mice), flagellin [1 µg/mL] (n = 6 mice), flagellin [3 µg/mL] (n = 6 mice), PolyI:C [1 µg/mL] (n = 6 mice), or intraperitoneal (i.p.) injection of PBS (n = 6 mice), flagellin [20 µg/mL] (n = 6 mice), PolyI:C [4 mg/mL] (n = 5 mice), LPS [500 µg/mL] (n = 6 mice) (*P < 0.05 significance from PBS enema group by non-parametric two-tailed Wilcoxon each pair test). Error bars indicate S.E.M.

References

    1. Bohórquez, D. V. et al. Neuroepithelial circuit formed by innervation of sensory enteroendocrine cells. J. Clin. Invest.125, 782–786 (2015). - PMC - PubMed
    1. Bellono, N. W. et al. Enterochromaffin cells are gut chemosensors that couple to sensory neural pathways. Cell170, 185–198 (2017). - PMC - PubMed
    1. Kaelberer, M. M. et al. A gut-brain neural circuit for nutrient sensory transduction. Science361, eaat5236 (2018). - PMC - PubMed
    1. Buchanan, K. L. et al. The preference for sugar over sweetener depends on a gut sensor cell. Nat. Neurosci.25, 191–200 (2022). - PMC - PubMed
    1. Furness, J. B., Rivera, L. R., Cho, H. J., Bravo, D. M. & Callaghan, B. The gut as a sensory organ. Nat. Rev. Gastroenterol. Hepatol.10, 729–740 (2013). - PubMed

MeSH terms

LinkOut - more resources