. 2025 Aug;644(8075):83-88.
doi: 10.1038/s41586-025-09318-y. Epub 2025 Jul 23.

Magnon spectroscopy in the electron microscope

Affiliations

Magnon spectroscopy in the electron microscope

Demie Kepaptsoglou et al. Nature. 2025 Aug.

Abstract

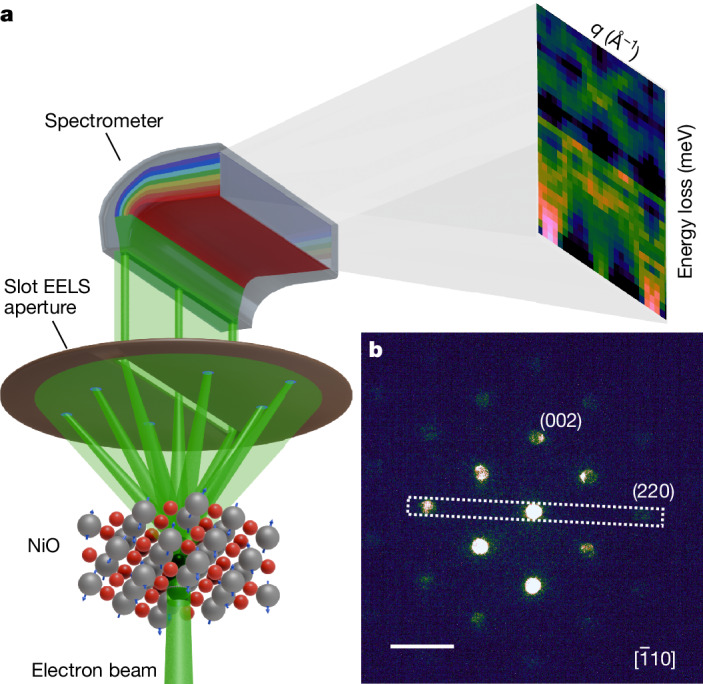
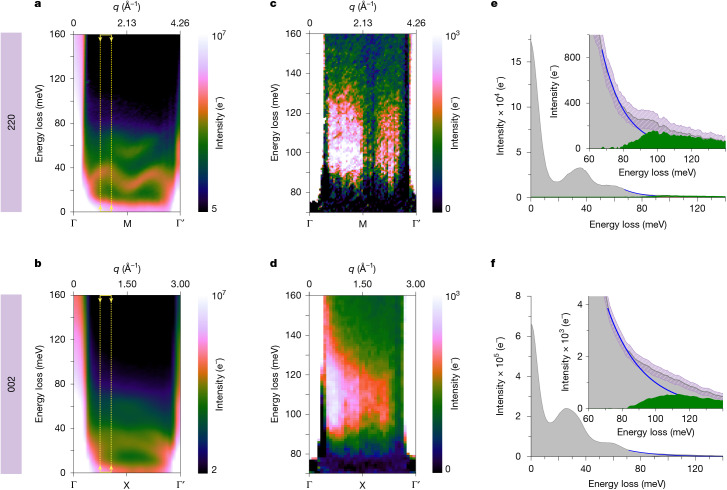
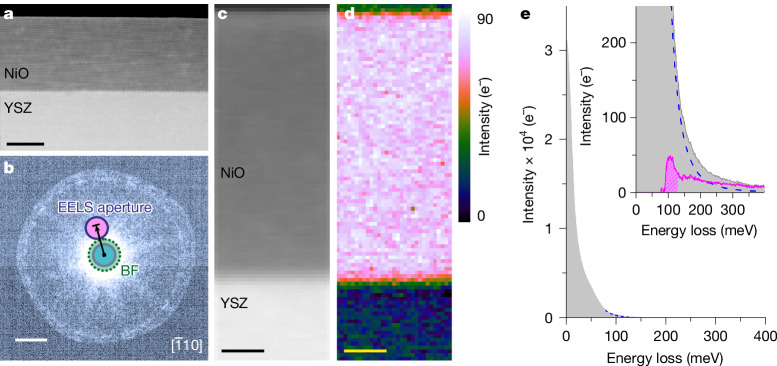
The miniaturization of transistors is approaching its limits owing to challenges in heat management and information transfer speed1. To overcome these obstacles, emerging technologies such as spintronics2 are being developed, which make use of the electron's spin as well as its charge. Local phenomena at interfaces or structural defects will greatly influence the efficiency of spin-based devices, making the ability to study spin-wave propagation at the nanoscale and atomic scale a key challenge3,4. The development of high-spatial-resolution tools to investigate spin waves, also called magnons, at relevant length scales is thus essential to understand how their properties are affected by local features. Here we detect bulk THz magnons at the nanoscale using scanning transmission electron microscopy (STEM). By using high-resolution electron energy-loss spectroscopy with hybrid-pixel electron detectors, we overcome the challenges posed by weak signals to map THz magnon excitations in a thin NiO nanocrystal. Advanced inelastic electron scattering simulations corroborate our findings. These results open new avenues for detecting magnons and exploring their dispersions and their modifications arising from nanoscale structural or chemical defects. This marks a milestone in magnonics and presents exciting opportunities for the development of spintronic devices.


Conflict of interest statement

Competing interests: The authors declare no competing interests.

Figures

Fig. 1
Fig. 1. Experimental geometry of momentum-resolved EELS.
a, Schematic representation of the geometry of ωq vibrational EELS measurements using a rectangular slot collection aperture. b, Experimental diffraction pattern along the NiO [1¯10] zone axis at a 2.25 mrad convergence angle, with the monochromating slit inserted, showing the orientation of the slot EELS collection aperture along the 220 row of systematic Bragg reflections in diffraction space. Scale bar, 2.5 Å−1, 20 mrad.
Fig. 2
Fig. 2. Momentum-resolved vibrational EELS measurements of NiO.
a,b, As-acquired ωq maps along the 220 and 002 rows of reflections, respectively, showing the dispersion of the NiO LA and LO phonon branches. For clarity, the intensity of the maps (calibrated in electrons, e) is shown on a logarithmic colour scale. c,d, Background-subtracted ωq maps showing the dispersion of the magnon bands at about 100 meV. e,f, Integrated spectra at the momentum positions marked by arrows in panels a and b. Insets, background-subtracted spectra (green-shaded area), obtained by removing a first-order log-polynomial model (blue line) from the raw signal (grey-shaded area). Pink-shaded areas illustrate the error bars as confidence bands at a +/−5σ level (σ is the standard deviation, calculated by assuming that the magnon scattering and noise populations are Poisson distributed; see Supplementary Note 3).
Fig. 3
Fig. 3. Calculated vibrational and magnon EELS of NiO.
ad, Simulated momentum-resolved EELS (dispersion curves) of phonon (a,c) and magnon (b,d) excitations, along the Γ → M and Γ → X q paths of the Brillouin zone for NiO, respectively. Experimental parameters such as sample temperature, environmental magnetic field inside the microscope and electron-optical parameters are considered (Methods).
Fig. 4
Fig. 4. Spatially resolved magnon EELS measurements across a NiO thin film.
a, High-angle annular-dark-field image of a 30-nm NiO thin film grown on a YSZ substrate. b, Experimental diffraction pattern along the NiO [1¯10] zone axis at a 31 mrad semi-convergence angle, with the monochromating slit inserted, showing the off-axis displacement of the round EELS collection aperture along the [002] direction (marked by the black arrow). c, Asymmetric (displaced) annular-dark-field image acquired during EELS measurements. d, Integrated intensity map of the magnon peak over the energy window indicated by a shaded area, after background subtraction, as illustrated in e with the signal integrated over the whole NiO film area (the background-subtracted version is presented, pink curve, inset). Scale bars, 15 nm (a); 7.7 Å−1, 60 mrad (b); 5 nm (c,d).
Extended Data Fig. 1
Extended Data Fig. 1. Imaging of the NiO single-crystal sample.
a, Annular dark-field image of the edge of a NiO single crystal, acquired with a 2.25 mrad semi-convergence angle (about 1.3 nm probe) along the [100] zone axis. Inset, experimental diffraction pattern along the NiO [100] zone axis at a 2.25 mrad semi-convergence angle, with the monochromating slit inserted, showing the orientation of the EELS collection slot aperture along the (002) row of reflections (dashed yellow box). b, Atomic-resolution high-angle annular dark-field STEM image acquired using a 31 mrad semi-convergence angle from the area marked with a yellow square in panel a.
Extended Data Fig. 2
Extended Data Fig. 2. Vibrational EELS measurements of NiO.
a, EELS spectrum corresponding to a single acquisition frame (75 ms) in vacuum, showing a ZLP measuring 7.2 meV at the FWHM. b, As-acquired ωq maps along the 220 row of NiO reflections, showing the dispersion of the NiO LA/LO phonon branches, as well as the LA gain branch, presented on a logarithmic intensity scale. The dataset corresponds to 15,000 integrated frames (75 ms each).
Extended Data Fig. 3
Extended Data Fig. 3. Magnon dispersions at different temperatures.
Calculated magnon dispersions corresponding to the dynamical structure factor computed using UppASD for a NiO supercell consisting of 32 × 32 × 32 repetitions of the cubic unit cell with periodic boundary conditions applied in all directions. The ASD simulations were performed using a time step of 0.1 fs over a total simulation time of 15 ps, with the remaining parameters the same as in the main text.
Extended Data Fig. 4
Extended Data Fig. 4. Experiment versus theory.
a,b,d,e, Experimental background-subtracted (a,d) and calculated (b,e) ωq EELS maps showing the dispersion of the magnon bands above 100 meV. c,f, Extracted spectra over a narrow momentum window (Δq = 0.22 Å−1), to avoid spectral broadening through momentum averaging, at the value at which the intensity is maximum along Γ → M (q = 1.24 Å−1) and Γ → X (q = 0.97 Å−1), marked by the yellow arrows and dashed lines in a and d, respectively. Calculated spectra at the same wave vector and averaged over a similar momentum window highlight the shape of the peaks, with a rising edge from 80 meV reaching a maximum at about 100 meV, before a weaker feature extending up to 120 meV, with the peak observed along Γ → X being broader and more rounded.

References

    1. Mamaluy, D. & Gao, X. The fundamental downscaling limit of field effect transistors. Appl. Phys. Lett.106, 193503 (2015).
    1. Wolf, S. A. et al. Spintronics: a spin-based electronics vision for the future. Science294, 1488–1495 (2001). - PubMed
    1. Barman, A. et al. The 2021 magnonics roadmap. J. Phys. Condens. Matter33, 413001 (2021). - PubMed
    1. Flebus, B. et al. The 2024 magnonics roadmap. J. Phys. Condens. Matter36, 363501 (2024). - PubMed
    1. Chumak, A. V., Serga, A. A. & Hillebrands, B. Magnonic crystals for data processing. J. Phys. D Appl. Phys.50, 244001 (2017).