. 2025 Aug;26(8):1384-1396.
doi: 10.1038/s41590-025-02223-6. Epub 2025 Jul 23.

Early methionine availability attenuates T cell exhaustion

Affiliations

Early methionine availability attenuates T cell exhaustion

Piyush Sharma et al. Nat Immunol. 2025 Aug.

Abstract

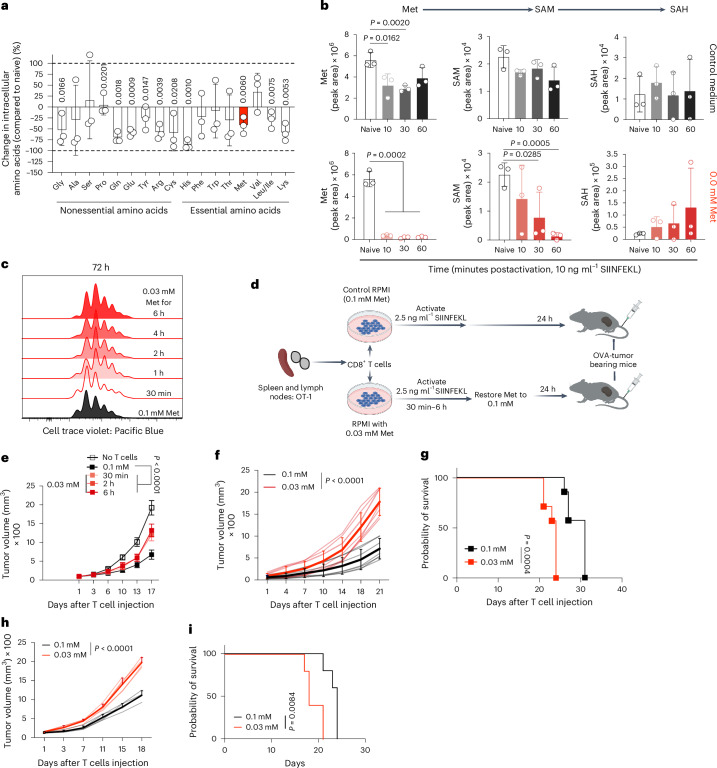
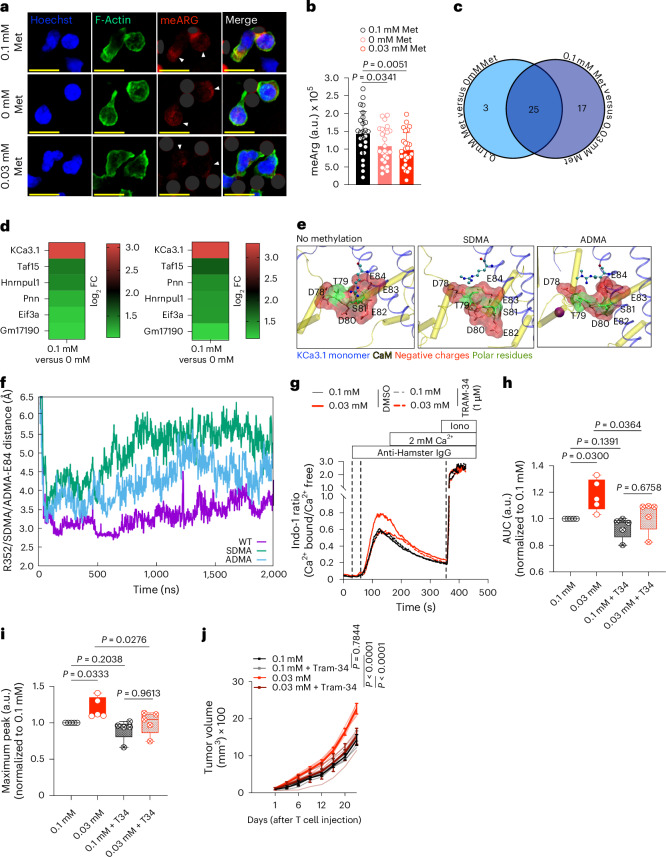
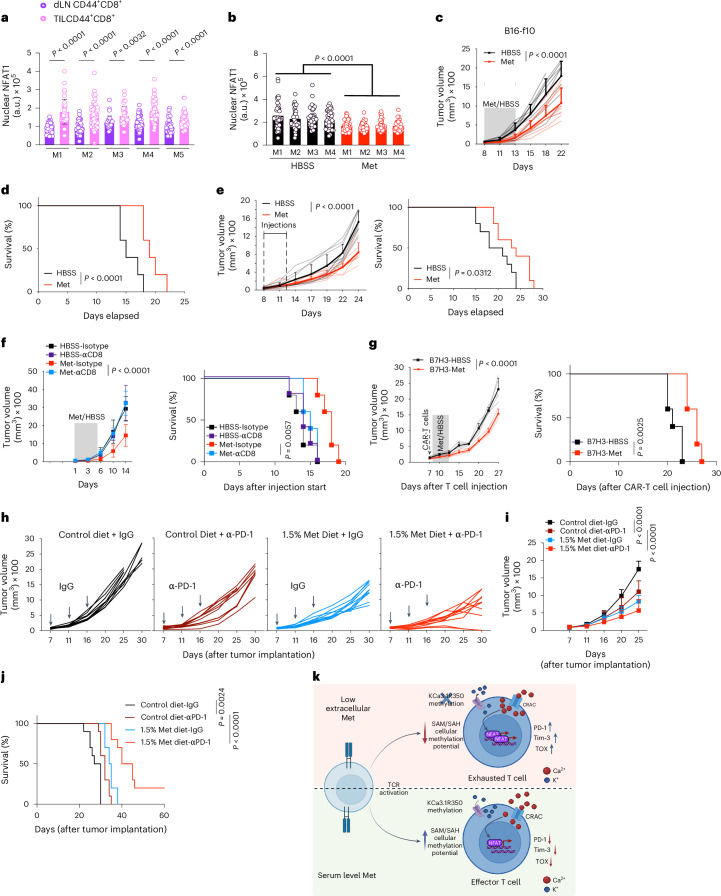
T cell receptor (TCR) activation is regulated in many ways, including niche-specific nutrient availability. Here we investigated how methionine (Met) availability and TCR signaling interplay during the earliest events of T cell activation affect subsequent cell fate. Limiting Met during the initial 30 min of TCR engagement increased Ca2+ influx, NFAT1 (encoded by Nfatc2) activation and promoter occupancy, leading to T cell exhaustion. We identified changes in the protein arginine methylome during initial TCR engagement and identified an arginine methylation of the Ca2+-activated potassium transporter KCa3.1, which regulates Ca2+-mediated NFAT1 signaling for optimal activation. Ablation of KCa3.1 arginine methylation increased NFAT1 nuclear localization, rendering T cells dysfunctional in mouse tumor and infection models. Furthermore, acute, early Met supplementation reduced nuclear NFAT1 in tumor-infiltrating T cells and augmented antitumor activity. These findings identify a metabolic event early after T cell activation that affects cell fate.


Conflict of interest statement

Competing interests: E.S.G. consults for Anviron and G.K. has patent applications in the fields of cell or gene therapy for cancer and has received honoraria from Cell Signaling and Kineticos within the last 2 years. During the course of this research, D.R.G. consulted for Sonata Therapeutics, Ventus Therapeutics, Mycos and ASHA Therapeutics, and received honoraria, travel and/or research support from Horizon/Amgen, Lilly and Boeringher-Ingleheim. The other authors declare no competing interests.

Figures

Fig. 1
Fig. 1. TCR-mediated, rapid Met consumption governs T cell effector function.
a,b, Quantification of intracellular amino acids at 10 min (a) and SAM and SAH up to 60 min (b) in OT-I T cells activated with 10 ng ml−1 SIINFEKL (n = 3 biological replicates). c, T cell proliferation by means of cell-trace violet staining of OT-I CD8+ T cells activated in either 0.1 mM Met or 0.03 mM Met for the times indicated before restoration to 0.1 mM Met in 0.03 mM Met conditions and then analyzed 72 h postactivation. Representative of three biological replicates per group. d, Schematic design for OT-I T cell activation initially in 0.1 or 0.03 mM Met, followed by restoration of Met to 0.1 mM for 24 h before injection into B16-OVA tumor-bearing mice. e, Tumor growth of B16-OVA in Rag1−/− treated with OT-I CD8+ T cells activated as described in d for 30 min–6 h (n = 5 mice per group). f,g, Tumor growth (f) and survival (g) of B16-OVA tumors in Rag1−/− mice after transfer of 24-h-activated OT-I T cells with first 30 min of stimulation being in 0.1 or 0.03 mM Met with 2.5 ng ml−1 SIINFEKL before restoration to 0.1 mM Met (n = 5 mice per group). h,i, Tumor growth (h) and survival (i) of B16-OVA tumors treated with activated GP33+-memory T cells as described in Extended Data Fig. 1d (n = 5 mice per group). Data are mean ± s.d. Paired two-tailed Student’s t-test (a), unpaired one-tailed Student’s t-test (b), two-way ANOVA (e, f, h) and Mantel–Cox log rank test (g, i). Illustrations in d created with BioRender.com. Source data
Fig. 2
Fig. 2. Reduced Met availability during TCR signaling promotes T cell exhaustion.
a, Schematic of experimental design. OT-I CD8+ T cells with different congenic markers were initially activated in 0.1 mM or 0.03 mM Met for 30 min with replenishment of 0.1 mM Met for 24 h, transferred into a B16-OVA tumor-bearing Rag1−/− mouse at a 1:1 ratio (day 0 (D0) and analyzed on day 12 (D12) after T cell transfer. b,c, Frequencies (b) and absolute number (c) of transferred T cells isolated from B16-OVA tumors at D12 posttransfer (n = 7 mice per group). d,e, Frequency of PD-1+ (d) and IFNγ+TNF+ (e) OT-I CD8+ TIL, initially activated in 0.1 mM and 0.03 mM Met and assessed at D12 postinjection (as in a) (n = 7 mice per group). f,g, Contour plot (f) and frequency of TOX+ cells (g) and of OT-I CD8+ TIL as in d (n = 7 mice per group). h,i, Representative contour plot (h) and quantification (i) of TCF1- and Tim-3-expressing cells from TOX+CD8+ TIL from OT-I CD8+ T cells isolated at D12 posttransfer as in a (n = 7 mice per group). j, Standard names of T cell exhaustion genesets in GSEA analysis of RNA-seq of OT-I CD8+ TIL on D9 after T cell injection as in Fig. 1f (n = 4). NES, normalized enrichment score. Data are mean ± s.d.; paired two-tailed Student’s t-test. Illustrations in a created with BioRender.com. Source data
Fig. 3
Fig. 3. Extracellular Met availability regulates Ca2+-mediated NFAT1 activity.
a, Representative plot of Indo-1 analysis of Ca2+ flux of either CD8+ T cells naive or activated with anti-CD3 and anti-CD28 by anti-hamster IgG crosslinking in either 0.1 mM or 0.03 mM Met-containing Ca2+-free Ringer solution with addition of 2 mM Ca2+ to measure Ca2+ influx (n = 3 biological replicates per group). iono, ionomycin. b,c, Area under the curve (AUC) (b) and maximum peak signal (c) of the calcium flux from a, normalized to values of activated cells in 0.1 mM Met (n = 3 biological replicates per group). d, Representative images of T cells, cultured with or without anti-CD3/28 Dynabeads (dark gray masked), in 0.1 mM and 0.03 mM Met, with or without CsA treatment for 30 min, stained for NFAT1 (red), Hoechst (blue) and Phalloidin (green) (dashed lines indicate nuclei). The identical figure without masking or nuclear demarcation is shown in Extended Data Fig. 5a. e, Quantification of NFAT1 intensity as nuclear to total cell ratio (c). Each circle represents one cell, n = 40 cells per group. Scale bar, 10 μm. f, Histogram of NFAT1-binding signals (read count per million reads normalized to background) from NFAT1 CUT&RUN on T cells initially activated in 0.1 or 0.03 mM Met for 30 min and assessed 24 h postactivation. g,h, NFAT1 CUT&RUN peaks at the known target genes (g) and quantification of known NFAT1-binding regions of Lag3, Pdcd1, Havcr2, Ctla4 and Tnfrsf9 and Tox (h, normalized read count (see differential binding analysis)) in T cells initially activated in 0.1 or 0.03 mM Met for 30 min and assessed 24 h postactivation (n = 2 biological replicates per group). Data are mean ± s.d. Boxplots shows minimum and maximum value with median as center. Paired two-tailed Student’s t-test (b and c), unpaired two-tailed Student’s t-test (e). Source data
Fig. 4
Fig. 4. TCR activation-mediated KCa3.1 methylation regulates T cell effector function.
a,b, Representative images (a) and quantification (b) of methylarginine (meArg) in CD8+ T cells activated with anti-CD3/28 Dynabeads (dark gray masked) in 0.1, 0 and 0.03 mM Met for 30 min, stained with pan-meArg (red, with arrows), Hoechst (blue) and Phalloidin (green) (each circle represents one cell; n = 26 cells per group. Scale bar, 10 μm. c, Venn diagram of enriched meArg proteins at 30 min postactivation of T cells in 0.1 mM versus 0 mM or 0.1 mM versus 0.03 mM Met, by anti-CD3:IgG crosslinking for 30 min, as identified by TMT-MS. d, Heatmap of TMT-MS-identified proteins (P < 0.05) with enriched meArg in T cells activated in 0.1 mM versus 0 mM or 0.03 mM Met as in c (n = 2 biological replicates per group). e, Predicted interaction of KCa3.1 monomer with CaM as unmethylated (left), SDMA (center) and ADMA (right). The CaM-binding pocket is represented as surface rendering with interacting amino acids as sticks and R352 as ball and sticks. f, MD simulation analysis. Analysis of variations of distance of salt bridge between CaM E84 and demethylated R352 WT (purple), SDMA R352 (green) and ADMA R352 (blue) over the course of simulation time (averaged across all four monomers, three MD trials). g, Representative plot of Indo-1 analysis of Ca2+ flux in CD8+ T cells activated with anti-CD3 and anti-CD28 by anti-hamster IgG crosslinking in Ca2+-free Ringer solution supplemented with either 0.1 mM or 0.03 mM Met and treated with either with DMSO or 1 μM TRAM-34 (n = 5 biological replicates per group). h,i, AUC (h) and maximum peak signal (i) from g normalized to 0.1 mM Met (n = 5 biological replicates per group). j, Tumor growth of B16-OVA tumors in Rag1−/− mice after transfer of OT-I CD8+ T cells activated in 0.1 mM or 0.03 mM Met with either DMSO or 1 μM TRAM-34 for 30 min and cultured for 24 h (n = 5 mice per group). Data are mean ± s.d. Boxplots shows minimum and maximum value with median as center. Unpaired two-tailed Student’s t-test (b), paired two-tailed Student’s t-test (h,i), two-way ANOVA (j). Source data
Fig. 5
Fig. 5. Ablation of KCa3.1 R350 methylation increases Ca2+-mediated NFAT1 activity, promoting T cell dysfunction.
a, Representative plot of Indo-1 analysis of Ca2+ flux in KCa3.1WT and KCa3.1R350A T cells activated with anti-CD3 and anti-CD28 by anti-hamster IgG crosslinking in Ca2+-free Ringer solution (n = 6). b,c, AUC (b) and maximum peak signal (c) of calcium flux in a, normalized to the values of activated KCa3.1WT (n = 6 biological replicates per group). d,e, Representative image (d) and quantification of NFAT1 intensity as nuclear to total cell ratio (dashed lines indicate nuclei) (e) in KCa3.1WT and KCa3.1R350A OT-I T cells activated for 30 min with anti-CD3/28 Dynabeads (dark gray masked) (see Extended Data Fig. 7f for identical, unmasked figure) (each circle represents one cell, n = 40 cells). Scale bar, 10 μm. f, Chromatin accessibility heatmap of T cells expressing activated KCa3.1WT or KCa3.1R350A with each row representing peaks (P < 0.05 and log2 FC > 1.5) displayed over the span of a 2-kb window with peak as center (grouped from least to maximum differential region), analyzed 24 h postactivation with 2.5 ng ml−1 SIINFEKL (n = 3). g, GOBP terms associated with negative regulation of T cells enriched in OT-I T cells expressing KCa3.1R350A versus KCa3.1WT activated as in b (n = 3). h, Standard names of T cell exhaustion genesets in GSEA analysis of differential accessible promoter reads from ATAC-seq of OT-I T cells expressing KCa3.1WT or KCa3.1R350A, activated with 2.5 ng ml−1 SIINFEKL for 24 h (n = 3). i,j, Tumor growth (i) and survival (j) of B16-OVA tumor-bearing RAG−/− mice after transfer of KCa3.1WT and KCa3.1R350A OT-I T cells (n = 5). k, B16-OVA tumors harvested at D12 post transfer of KCa3.1WT and KCa3.1R350A OT-I T cells (n = 4). Data are mean ± s.d. Boxplots shows minimum and maximum values with median as center. Paired two-tailed Student’s t-test (b and c), unpaired two-tailed Student’s t-test (e), two-way ANOVA (i) and Mantel–Cox log rank test (j). Source data
Fig. 6
Fig. 6. Ablation of KCa3.1 R350 methylation promotes T cell exhaustion in tumors and infection models.
a, Schematic of experimental design to assess congenically distinct KCa3.1WT and KCa3.1R350A OT-I T cells mixed at a 1:1 ratio and transferred into B16-OVA tumor-bearing Rag1−/− mice, analyzed D12 after T cell transfer. be Representative plot and frequency of PD-1+Tim-3+ (b), histogram and quantification of TOX MFI (c), quantification of TCF1 MFI (d) and frequency of IFNγ+TNF+ (e) and among KCa3.1WT and KCa3.1R350A OT-I TIL at D12 after T cell transfer as in a (n = 7 mice per group). f,g, Representative plot (f) and frequency of TCF1+Tim-3 Texprog and TCF1Tim-3+ Texterm (g) in KCa3.1WT and KCa3.1R350A OT-I TIL at D12 after T cell transfer as in a (n = 7 mice per group). h, Schematic of experimental design to assess congenically distinct KCa3.1WT and KCa3.1R350A Thy1.1 P14 T cells, mixed at a 1:1 ratio and transferred into WT mice infected with LCMV-Clone-13. Spleens were analyzed at D9 postinfection. i, Representative plot and frequency of TOX+ in KCa3.1WT and KCa3.1R350A P14 CD8+ T cells from spleens at D9 postinfection as in g (n = 4 mice per group). j,k, Representative plots (j) and frequency of PD-1+Tim-3+ (k) in KCa3.1WT and KCa3.1R350A P14 CD8+ T cells from spleens at D9 postinfection as in g (n = 4 mice per group). l,m, Frequency of TCF1+Tim-3 Texprog (l) and TCF1Tim-3+ Texterm (m) in KCa3.1WT and KCa3.1R350A P14 CD8+ T cells from spleens at D9 postinfection as in g (n = 4 mice per group). Data are mean ± s.d. Paired two-tailed Student’s t-test (be, g, im). Illustrations in a and h created with BioRender.com. Source data
Fig. 7
Fig. 7. Acute Met supplementation promotes CD8+ T cell-mediated tumor control and enhances ICB.
a, Nuclear NFAT1 quantification in CD44+CD8+ T cells isolated from B16 tumors and respective dLNs at D9 postimplantation (each circle represents one cell, n = 40 cells, n = 5 (Mouse (M)1–M5)). b, Quantification of nuclear NFAT1 in CD44+ CD8+ T cells isolated from B16 tumors after 5 days of peritumoral supplementation of 50 μl HBSS or 61 μM Met per day (each circle represents one cell; n = 40 cells, n = 4 (M1–M4)). ce, Tumor growth (c) and survival (d) of B16 or MC38 (e) tumor-bearing WT mice, supplemented either with HBSS or 61 μM Met peritumorally for 5 days as in b (n = 10 mice per group). f, B16 tumor growth (left) and survival (right) of WT mice, treated intraperitoneally with IgG isotype or anti-CD8 antibody at D1 and D3 and treated peritumorally with HBSS or Met from D7 to D12 as in b (n = 5 mice per group, representative of two experiments). g, Tumor growth (left) and survival (right) of F420 tumor-bearing Rag1−/− mice injected with B7-H3 CAR-T cells at D0 and peritumorally treated with HBSS or Met from D1 to D6 as in b (n = 5 mice per group). hj, Tumor growth (h,i) and survival (j) of MC38 tumor-bearing WT mice, treated either with anti-PD-1 or IgG isotype (arrows in i) and fed with either a control (1% Met) or Met-rich (1.5% Met) diet as shown in Extended Data Fig. 10h (n = 10 mice per group). k, Diagram illustrating the impact of Met metabolism on TCR-dependent methylation of KCa3.1, leading to regulation of Ca2+ flux and subsequent activation of NFAT1. Low extracellular Met levels lead to decreased methylation potential, reducing KCa3.1 R350 methylation. This results in increased Ca2+ flux and downstream NFAT1 activation and consequent T cell hyperactivation and exhaustion. Data are mean ± s.d. Unpaired two-tailed Student’s t-test (a), two-way ANOVA (c, eg, i), and Mantel–Cox log rank test (dg, j). Statistical analysis of b is described in Methods. Illustrations in k created with BioRender.com. Source data
Extended Data Fig. 1
Extended Data Fig. 1. Methionine availability during TCR activation determines T cell fate.
a, Log2 fold change (FC) in serum Met levels post LCMV-C13 chronic infection (data from ref. ). b, c, Tumour growth (b) and survival (c) of B16-OVA tumour-bearing WT mice treated with or without OT-I CD8+ T cells activated in 0.1 or 0.03 mM Met for 30 min before restoring Met to 0.1 mM for 24 h, as described in Fig. 1d (n = 5 mice/group). d, Schematic of experimental design (Fig. 1d) for generation of LCMV-GP33 specific T cells, which were then activated as shown before injection into B16-OVA tumour-bearing Rag1−/− mice. e, Schematic design for ATAC-Seq on OT-I T cells initially activated in 0.1 or 0.03 mM Met followed by restoration of Met to 0.1 mM for 24 h. Data are mean±s.d. 2-way ANOVA (b), and Mantel-Cox log rank test (c). Illustrations in d, and e were generated with Biorender.com. Source data
Extended Data Fig. 2
Extended Data Fig. 2. Reduced methionine during TCR activation promotes T cell exhaustion.
a, PCA analysis of ATAC-Seq of OT-I T cells activated with 2.5 ng/ml SIINFEKL in 0.1 mM and 0.03 mM Met, then cultured in 0.1 mM Met for 24 h. b, Chromatin accessibility heatmap of T cells initially activated in 0.1 or 0.03 mM Met with each row representing peaks (p < 0.05 and log2 fold-change >1.5) displayed over the span of a 2 kb window with peak as center (grouped from least to max differential region), analyzed from ATAC-Seq from (a). c, Over-representation analysis of the differentially accessible regions (DAR) from (b) showing the top 5 gene sets associated with exhaustion. d, Homer analysis of (a) showing top 20 motifs and their percent coverage. Colour corresponds to the common exhaustion-associated motifs described in the indicated studies (blue and purple). e, f, Tumour growth (e) and weight (f) of B16-OVA tumour-bearing Rag1−/− mice injected with OT-I T cells as in Fig. 1d. g, Frequency of CD62L+, Tcm (CD62Lhi CD44hi), TOX expression (MFI), and IFNγ+ in OT-I CD8+ TIL isolated from B16-OVA tumour-bearing Rag1−/− mice at D9 post-injection with OT-I T cells activated as in Fig. 1d. h, Frequency of PD1+ Tim-3+ on OT-I CD8+ T cells at D12 post transfer of OT-I T cells as in Fig. 2a. i, Frequency of TCF1+ on OT-I CD8+ T cells at D12 post transfer of OT-I T cells as in Fig. 2a (n = 7). j, k, Frequency of Texprog and Texterm identified via differential expression of TCF1 and Tim-3 (j) or Tim-3 and Ly108 (k) on OT-I CD8+ T cells as in Fig. 2a. ln, Representative contour plot and quantification of CD127+CD27+ memory cells (l, m) and CD62L+ T memory cells in OT-I CD8+ T cells as in Fig. 2a. o, Frequencies of PD1+Tim-3+ exhausted T cells and Tim-3+Ly108 TEXterm cells in OT-I CD8+ TIL isolated at D12 post of cells activated as in Fig. 1d from MC38-OVA tumour-bearing Rag1−/− mice. (ad: n = 3 mice/group; e-g: n = 5 mice/group; h-o: n = 7 mice/group). Data are mean±s.d. Boxplots shows min and max value with median as center. 2-way ANOVA (e), unpaired two-tailed Student’s t-test (f, g) paired two-tailed Student’s t-test (hp). Source data
Extended Data Fig. 3
Extended Data Fig. 3. RNA-Seq analysis shows enrichment of an exhaustion signature in low Met.
a, Volcano plot and top ten differentially expressed (DE) genes (red) (0.1 mM vs 0.03 mM, p < 0.05, FC > 1.5) from OT-I CD8+ TIL isolated from mice injected with OT-I T cells, initially activated in 0.1 mM Met or 0.03 mM Met (as in Fig. 1d), at day 9 post injection into B16-OVA tumour-bearing mice. b, Heatmap of DE genes, which shows increased expression in cells initially activated in either 0.03 mM Met or 0.1 mM Met from the RNAseq in (a). c, Over-representation analysis of DE genes with higher expression in TIL initially activated in 0.1 mM Met, showing enrichment of biological processes and transcription factors associated with T cell effector function and regulation. d, Over-representation analysis of DE genes with higher expression in TIL initially activated in 0.03 mM Met, showing enrichment of gene sets and transcription factors associated with promotion and maintenance of the exhausted T cell state. e, GSEA analysis of hallmark gene sets as analyzed from RNA-Seq of OT-I TIL initially activated in 0.1 or 0.03 mM Met, isolated from B16-OVA tumours at D9 post transfer. (ae: n = 4 mice/group). RNA-Seq statistics were applied as described in Methods.
Extended Data Fig. 4
Extended Data Fig. 4. Met limitation promotes TCR-induced Ca2+ flux.
a, Representative plot of Indo-1 analysis of Ca2+ flux of CD8+ T cells in ringer solution with 2 mM Ca2+, activated with anti-CD3 and anti-CD28 by anti-hamster IgG crosslinking in either 0.1 mM or 0.03 mM Met (n = 5). b, c, Normalized AUC (b) and max peak value (c) of Ca2+ flux analysis in (a) (n = 5). d, Representative plot of Fluo-8 AM analysis of Ca2+ flux in CD8+ T cells activated with anti-CD3 and anti-CD28 and anti-hamster IgG crosslinking in either 0.1 mM or 0.03 mM Met-containing Ca2+ Ringer solution with addition of 2 mM Ca2+ to measure Ca2+ influx (n = 2). e, Representative plot of Fluo-8 AM analysis of Ca2+ flux in CD8+ T cells activated with anti-CD3 and anti-CD28 and anti-hamster IgG crosslinking in Ca2+-free Ringer solution containing either 0.1 mM or 0.03 mM Met and treated for one hour with DMSO or 5 μM YM58483 (n = 2). f, g, Representative plot (f) and normalized AUC (g) of Indo-1 analysis of Ca2+ flux in CD8+ T cells activated with anti-CD3 and anti-CD28 and anti-hamster IgG crosslinking in Ca2+-free Ringer solution containing either 0.1 mM or 0.03 mM Met and treated with either DMSO or 15 μM YM58483. (ac: n = 5 mice/group; d, e: n = 2 mice/group; f, g: n = 3 mice/group). Data are mean±s.d. Boxplots shows min and max value with median as center. Paired two-tailed Student’s t-test (b, c). Source data
Extended Data Fig. 5
Extended Data Fig. 5. Met limitation results in increased TCR-mediated NFAT1 activation.
a, Unedited image of Fig. 3d showing the unmasked, red anti-CD3/38 Dynabeads which are masked grey in the main Figure to highlight NFAT1 staining. b, NFAT1 intensity quantification (nuclear to total cell ratio) of CD8+ T cells activated in either 0.1 mM, 0.00 mM or 0.03 mM Met for 30 min with anti CD3/28 Dynabeads and stained for NFAT1 (each circle represents one cell, n = 28 cells/group). c, Quantification of nuclear NFAT1 from the experiment shown in Fig. 3d. d, NFAT1 intensity quantification (nuclear to total cell ratio) of CD8+ T cells activated for 30 min by CD3/28 Dynabeads in either 0.1 mM or 0.03 mM Met in the presence of DMSO or 5 μM YM58483 (each circle represents one cell, n = 47 cells/group). e, NFAT2 quantification (nuclear to total cell ratio) of CD8+ T cells, activated in 0.1 mM or 0.03 mM Met for 30 min with anti-CD3/28 Dynabeads (each circle represents one cell, n = 40 cells). f, NFAT1 quantification (nuclear to total cell ratio) of previously activated OT-I T cells, treated with anti-CD3/28 Dynabeads for 30 min. T cells were initially activated with 2.5 ng/ml SIINFEKL for 24 h in control medium and rested with 10 ng/ml mIL-7 for 48 h (each circle represents one cell, n = 50 cells/group). g, Normalized RNA expression quantified by quantitative-PCR performed 24 h post activation of OT-I CD8+ T cells activated with 2.5 ng/ml SIINFEKL in 0.1 mM or 0.03 mM Met for 30 min followed by 0.1 mM Met (n = 5–6 biological replicates/group). Data are mean±s.d. Unpaired two tailed Student’s t-test (bf), paired two-tailed Student’s t-test (g). Source data
Extended Data Fig. 6
Extended Data Fig. 6. Initial Met limitation alters KCa3.1 methylation, but not DNA or histone methylation.
a, Methylation potential of 10 ng/ml SIINFEKL-activated OT-I T cells in 0.1 mM or 0.0 mM Met at 10, 30 and 60 min. b, %5-methylcytosine (%5-mc) of OT-I CD8+ T cells activated with 2.5 ng/ml SIINFEKL in 0.1 mM or 0.03 mM Met for 30 min, then 0.1 mM Met for 24 h. c, d, Histograms (top) and heat-map (bottom) of H3K4me3 (c) and H3K27me3 (d) CUT&RUN (read count per million, normalized to background) in OT-I CD8+ T cells activated as in (b) at 24 h post activation. e, Unedited image of Fig. 4a with unmasked, red CD3/28 Dynabeads (grey in main Figure to highlight me-Arg staining). f, Conserved arginine (red) in KCa3.1, analyzed by protein-BLAST and visualized using Jalview. g, Tetrameric assembly of human KCa3.1-Calmodulin complex in membrane (left). KCa3.1 is represented as ribbons, calmodulin quartet as cartoon, interacting Ca2+ ions as purple spheres, and K+ ions as cyan spheres. KCa3.1 monomer (blue) shown in complex with calmodulin (yellow) and demethylated arginine-352 (green) (right). h, MD simulations analysis. Illustration of total counts of negatively charged residues within a 4 Å radius of all three R352/SDMA/ADMA of huKCa3.1 over simulation time (averaged across all four monomers, three MD trials). i, Representative plot of Fluo-8 AM analysis of Ca2+ flux in CD8+ T cells activated by IgG crosslinking anti-CD3 and anti-CD28 in Ca2+-free Ringer solution with either 0.1 mM or 0.03 mM Met and treated with either DMSO or 1 μM TRAM-34 (n = 2 mice/group). j, NFAT1 quantification (nuclear to total cell ratio) in OT-I CD8+ T cells activated for 30 min with anti CD3/28 Dynabeads in 0.03 mM Met (left) or 0.1 mM Met (right) in 0.5, 1 or 2 μM TRAM-34 (each circle=one cell, n = 27–45 cells/group). k, Schematic design for OT-I T cell activation in 0.1 or 0.03 mM Met, treated with DMSO or TRAM-34 for 30 min, followed by washing and culturing in 0.1 mM Met plus SIINFEKL (2.5 ng/ml) for 24 h before injection into B16-OVA tumour-bearing Rag1−/− mice. (ad: n = 3 mice/group) Data are mean±s.d. Unpaired one-tailed Student’s t-test (a) or unpaired two-tailed Student’s t-test (b, j). Illustration in k created with Biorender.com. Source data
Extended Data Fig. 7
Extended Data Fig. 7. KCa3.1 R350 methylation regulates Ca2+- mediated NFAT1 activation.
a, Schematic of experimental design of endogenous KCa3.1 knockdown with ectopic expression of KCa3.1WT and KCa3.1R350A in Cas9-OT-I or P14+ CD8+ T cells. b, Sorting strategy for in vitro-generated KCa3.1WT and KCa3.1R350A T cells; gate shows the cells that express WT or R350A KCa3.1 with endogenous KCa3.1 knockdown. c, Immunoblot showing knockdown of KCa3.1 with sgRNA1 and sgRNA2, compared to control. d, Immunoblot of KCa3.1 expression in KCa3.1WT- and KCa3.1R350A-expressing CD8+ T cells. e, Representative plots of Fluo-8 (left) and ICR-1 AM (right) analysis of Ca2+ flux in KCa3.1WT and KCa3.1R350A T cells activated with anti-CD3 and anti-CD28 by anti-hamster IgG crosslinking in Ca2+-free Ringer solution. f, Unedited image of Fig. 5d showing the unmasked CD3/38 Dynabeads which are masked grey in the main figure to highlight NFAT1 staining. g, Nuclear NFAT1quantification of KCa3.1WT and KCa3.1R350A, either control (no Dynabeads) or activated with anti-CD3/28 Dynabeads for 10 min (each circle represents one cell, n = 37–45 cells/group). Data are mean±s.d. Unpaired two-tailed Student’s t-test. Illustrations in a created with BioRender.com. Source data
Extended Data Fig. 8
Extended Data Fig. 8. Ablation of KCa3.1 R350 methylation shows similar ATAC-Seq signature as of T cells activated in reduced Met.
a, PCA analysis of ATAC-Seq of KCa3.1WT- and KCa3.1R350A- activated with 2.5 ng/ml SIINFEKL for 24 h. n = 3. b, Common DAR (p < 0.05, fold change>1.5) between ATAC-Seq of OT-I cells expressing KCa3.1WT or KCa3.1R350A, or OT-I cells initially activated in 0.1 mM or 0.03 mM Met as in (a) and Extended Data Fig. 2b. c, Over-representation analysis of the common DAR from (b) showing the top 8 gene sets associated with exhaustion and activation. d, e, Top 10 motifs analyzed by HOMER in ATAC-Seq DAR’s from 24 h activated OT-I CD8+ T cells expressing KCa3.1R350A vs KCa3.1WT (d), and from the common DAR’s from (b, e). Colour corresponds to the common exhaustion-associated motifs also described in the indicated studies (blue and purple).
Extended Data Fig. 9
Extended Data Fig. 9. Ablation of KCa3.1 R350 methylation promotes T cell exhaustion in an in-vivo tumor and infection model.
a, Tumour weight of B16-OVA tumours isolated at D12 post transfer of OT-I T cells expressing KCa3.1WT or KCa3.1R350A. b, Surface expression of PD1+, Lag3+ and PD1+Tim-3+ in CD8+ TIL isolated at D12 post transfer into B16-OVA tumour-bearing mice of OT-I T cells expressing KCa3.1WT or KCa3.1R350A. c, d, Representative histogram of TOX expression and quantification (c) and of Texprog (CD69loLy108hi) (d) in CD8+ TIL expressing KCa3.1WT or KCa3.1R350A isolated at D12 as in (b). e, Representative contour plot (left) and quantification of IFNγ+TNF+ (right) in OT-I T cells expressing KCa3.1WT or KCa3.1R350A at D12 post transfer as in (b). fh, Representative contour plot (f) and quantification (g) Texprog (Ly108+Tim-3) and Texterm (Ly108Tim-3+) and CD62L+ (h) on congenically marked OT-I T cells expressing KCa3.1WT or KCa3.1R350A, mixed and transferred at a ratio of 1:1. TIL were isolated from B16-OVA tumours at D12 post T cell transfer. i, Gating strategy to identify transferred Thy1.1+ CD8+ T cells in spleen at day 9 post infection. j, Frequency of KCa3.1WT- and KCa3.1R350A -expressing P14 T cells in spleens, D9 post infection with LCMV-Clone-13. k, Frequency of TCF1+ cells in KCa3.1WT- and KCa3.1R350A -expressing P14 T cells in spleens, analyzed as in (i). l, Frequency of Tim-3Ly108+ Texprog and Tim-3+Ly108 Texterm in KCa3.1WT- and KCa3.1R350A -expressing P14 T cells in spleens, analyzed as in (i). m, Frequency of Tim-3+Cx3CR1+PD1+ Texeff KCa3.1WT- and KCa3.1R350A -expressing P14 T cells in spleens, analyzed as in (i). (a, c, e, hl: n = 4 mice/group; b, d: n = 3 mice/group; f, g: n = 7 mice/group) Data are mean±s.d. Unpaired two-tailed Student’s t-test (ae) and paired two-tailed Student’s t-test (f, l). Source data
Extended Data Fig. 10
Extended Data Fig. 10. Acute Met supplementation enhances T cell mediated tumour control and tumour immunotherapies.
a, Quantification of amino acids (left) and peak area of Met (right) in CD8+ T cells from dLN and tumours at day 12 post implantation. b, Quantification of intracellular Met in CD8+ T cells from PBMC and primary patient colorectal tumours. c, Experimental design of acute HBSS/Met peri-tumoural treatment. d, Nuclear NFAT1 quantification of CD44+ CD8+ T cells from B16 subcutaneous tumours and dLN 5 days post HBSS/Met injection as in (c) (M=mouse, each circle=one cell, n = 40 cells/group). e, f, Tumour growth (left) and survival (right) of WT mice with sub-cutaneous Lewis-lung carcinoma (LLC) tumours (e) (representative of two experiments), and F420 osteosarcoma tumours (f) treated as in (c). g, h, MFI of PD1, frequency of PD1+Tim-3+ (g), Tcm (CD62LhiCd44hi) and Tem (CD62LloCD44hi) (h) on CD8+ TIL isolated from B16 tumours 2 days after 5 daily peri-tumoural injections with HBSS or Met. i, Growth of B16 and MC38 tumours in NSG mice treated as in (c). j, Representative plot showing % CD8 following anti-CD8 and IgG-treatment. k, Experimental design of contralateral tumour experiment. l, Growth of B16 tumours implanted as in (k) following treatment of flank tumours as in (c) (representative of two experiments). m, B16 growth in WT mice fed with either 1% Met chow or 1.5% Met chow for 7 days post implantation. n, o, Experimental design to assess the effect of HBSS or Met supplementation on CAR-T cell therapy in murine solid tumours (n) and on ICB (anti-PD1) treatment. p, Tumour growth (left) and survival (right) of MC38 in WT mice, treated either with anti-PD1 or IgG and supplemented with HBSS or Met as in (o) (representative of two experiments)., q, Experimental design of effect of Met-rich diet on tumour growth upon anti-PD1 or IgG treatment. (a, h: n = 3 mice/group; b: n = 8 patients/group; e-f, i, l-m, p: n = 5 mice/group; g: 4–5 mice/group; k: n = 4 mice/group). Data are mean±s.d. Unpaired (a, d, g, h) and paired (b) two-tailed Student’s t-test, two-way ANOVA (e, f, p (left), i, l, m) and Mantel-Cox log rank test (e, f, p(right)). Illustrations in c, k, n, o and q created with Biorender.com. Source data

Update of

References

    1. Thompson, E. D., Enriquez, H. L., Fu, Y. X. & Engelhard, V. H. Tumor masses support naive T cell infiltration, activation, and differentiation into effectors. J. Exp. Med.207, 1791–1804 (2010). - PMC - PubMed
    1. Prokhnevska, N. et al. CD8+ T cell activation in cancer comprises an initial activation phase in lymph nodes followed by effector differentiation within the tumor. Immunity56, 107–124 (2023). - PMC - PubMed
    1. Lim, A. R., Rathmell, W. K. & Rathmell, J. C. The tumor microenvironment as a metabolic barrier to effector T cells and immunotherapy. eLife9, e55185 (2020). - PMC - PubMed
    1. Wherry, E. J. & Kurachi, M. Molecular and cellular insights into T cell exhaustion. Nat. Rev. Immunol.15, 486–499 (2015). - PMC - PubMed
    1. Lan, X., Zebley, C. C. & Youngblood, B. Cellular and molecular waypoints along the path of T cell exhaustion. Sci. Immunol.8, eadg3868 (2023). - PMC - PubMed

MeSH terms

LinkOut - more resources