. 2025 Sep;26(17):4248-4282.
doi: 10.1038/s44319-025-00520-7. Epub 2025 Jul 23.

Uridine phosphorylase-1 supports metastasis by altering immune and extracellular matrix landscapes

Affiliations

Uridine phosphorylase-1 supports metastasis by altering immune and extracellular matrix landscapes

Declan Whyte et al. EMBO Rep. 2025 Sep.

Abstract

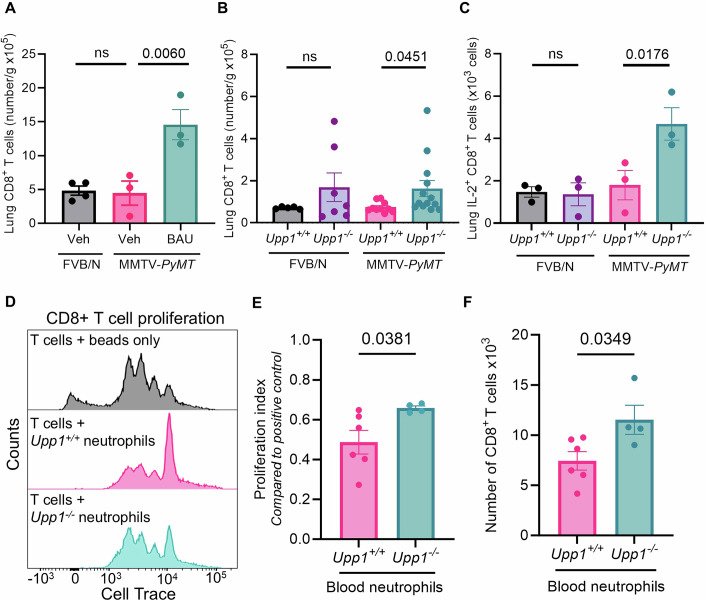
Understanding mechanisms that facilitate early events in metastatic seeding is key to developing therapeutic approaches to reduce metastasis. Here we identify uracil as a metastasis-associated metabolite in genetically engineered mouse models of cancer and in patients with metastatic breast cancer. Uracil is generated by the enzyme uridine phosphorylase-1 (UPP1), and we find that neutrophils are a significant source of UPP1 in metastatic cancer. Mammary tumours increase expression of adhesion molecules on the neutrophil surface, in a UPP1-dependent manner, leading to decreased neutrophil motility in the pre-metastatic lung. UPP1-expressing neutrophils suppress T-cell proliferation, and the UPP1 product uracil increases fibronectin deposition in the extracellular microenvironment. Knockout or inhibition of UPP1 in mice with mammary tumours increases T-cell numbers and reduces fibronectin content in the lung, and decreases the proportion of mice that develop lung metastasis. These data indicate that UPP1 influences neutrophil behaviour and extracellular matrix deposition in the lung, and suggest that circulating uracil could be a marker of metastasis, and that pharmacological inhibition of UPP1 could be a strategy to reduce recurrence.

Keywords: Fibronectin; Metastasis; Neutrophils; T Cells; Uridine Phosphorylase.


Conflict of interest statement

Disclosure and competing interests statement. The authors declare no competing interests.

Figures

Figure 1
Figure 1. The UPP1 product uracil positively correlates with metastasis in mouse models of metastatic cancer.
(A) Schematic representation of the experimental approach used to identify serum metabolites in MMTV-PyMT mice with significant correlations with lung metastatic burden, independent of any correlation with primary mammary tumour burden. Examples shown are pictorial representations of the trend of interest. (B) Serum uracil levels measured by LC–MS from MMTV-PyMT tumour-bearing mice, plotted against the number of lung metastases (n = 29 MMTV-PyMT mice). (C) Absolute quantification of serum uracil levels in MMTV-PyMT mice with no identified lung metastases (n = 7 mice) and MMTV-PyMT mice with >10 lung metastases (n = 6 mice). (D) Serum uracil levels were measured by LC–MS in the KPN mouse model of colon cancer, comparing serum from tail bleeds at 30 (n = 9 mice), 60 (n = 6 mice) and 90 (n = 6 mice) days post induction to serum from mice at clinical endpoint (metastatic colon cancer, n = 10 mice). (E) Serum uracil levels were measured by LC–MS from KPflC mice modelling poorly metastatic pancreatic cancer (n = 10 mice) and KPC mice modelling highly metastatic pancreatic cancer (n = 6 mice) at palpable pancreatic tumour, compared to age-matched wild-type (WT) controls (n = 12 mice). (F) Uracil levels were determined by LC–MS from plasma of human metastatic breast cancer patients (n = 99 patients) and healthy volunteers (n = 56 volunteers). (G) Schematic representation of the enzymatic reaction catalysed by uridine phosphorylase-1 (UPP1). (H) Increased expression of UPP1 correlates with decreased relapse-free survival in human breast cancer and colon cancer and decreased overall survival in pancreatic cancer (Data source: Gyorffy, 2024a, 2024b). Data Information: In (BF), each dot represents an individual mouse, or human, as appropriate. In (B), Spearman Correlation statistics are presented. In (CF), data are presented as mean ± SEM, with unpaired t test for comparison of two groups (C, F), and one-way ANOVA for more than two groups (D, E). In (D, E), when one-way ANOVA produced P < 0.0001, t and DF values provided by Šídák’s multiple comparisons test were used to calculate the exact P value. In (H), hazard ratio (HR) from the Cox model, and log-rank P value, are presented. Source data are available online for this figure.
Figure 2
Figure 2. Neutrophils are a source of Upp1.
(A) Wild-type (WT) mice on a C57BL/6 background were dosed intraperitoneally with 1 mg/kg lipopolysaccharide (LPS), and serum uridine and uracil measured by LC–MS at defined timepoints post dosing (n = 3 mice per experimental arm). (B) Upp1 data were extracted from https://github.com/chris-mcginnis-ucsf/pymt_atlas, allowing Upp1 to be assessed in immune cells from the lungs of WT or MMTV-PyMT tumour-bearing mice at varying timepoints in tumour progression (as assigned by early, mid or late). Cells were classified as b (B cells), t (T cells), nk (NK cells), neu (neutrophils), alv (alveolar macrophages), mono (monocytes), dc (dendritic cells), int (interstitial cells) and cells of unknown origin. Dot size represents the percentage of cells expressing Upp1, and dot colour represents average Upp1 expression levels (Data source: McGinnis et al, , n = 29 samples total). (C) UMAP plots of Ly6g (neutrophil marker) and Upp1 in splenic cells isolated from MMTV-PyMT tumour-bearing mice, colour represents average Upp1 expression levels (Data source: Alshetaiwi et al, , n = 3 mice pooled). (D) Upp1 was detected by qRT-PCR in neutrophils isolated from the bone marrow (BM) of FVB/N (n = 3 mice) or tumour-bearing MMTV-PyMT mice (n = 6 mice). (E) Extracellular 13C4,15N2-uracil was detected by LC–MS in either cells, or media, from BM neutrophils incubated in media containing 13C9,15N2-uridine for 24 h at 37 °C/5%CO2 (n = 3 mice per experimental arm). (F) Extracellular 13C4,15N2-uracil was detected as described for (E), using BM neutrophils isolated from FVB/N or tumour-bearing MMTV-PyMT mice (n = 3 mice per experimental arm). (G) Serum uracil assessed by LC–MS in tumour-bearing MMTV-PyMT mice treated with IgG control (n = 9 mice) or anti-Ly6G (n = 8 mice). Data Information: In (A, DG), each dot represents an individual mouse, and data are presented as mean ± SEM. Statistical testing used to calculate P values as follows: (A) one-way ANOVA; (D, F) one-sample t test assesses the MMTV-PyMT difference to 1; (E, G) unpaired t test. For (B, C), statistics were not performed. Source data are available online for this figure.
Figure 3
Figure 3. UPP1 influences neutrophil motility in the pre-metastatic lung through affecting surface expression of αM integrin.
(A) Centred neutrophil tracks obtained from confocal time-lapse microscopy of precision-cut lung slices (PCLS) from vehicle-treated FVB/N mice (n = 8 mice), vehicle-treated KP tumour-transplanted mice (n = 5 mice), and BAU treated KP tumour-transplanted mice (n = 4 mice), scale bar 7 µm. (B) Quantified motility of neutrophils from (A) (n = 8 vehicle-treated FVB/N mice; n = 5 vehicle-treated KP tumour-transplanted mice (3 of which, represented with triangles, were treated with isotype control antibody, and are presented in (E)), n = 4 BAU treated KP tumour-transplanted mice). (C) Representative histogram (left) of surface αM integrin on lung neutrophils (right) measured by quantifying the geometric median fluorescence intensity (gMFI) by flow cytometry of neutrophils from the lungs of FVB/N mice (represented by the dotted line at 1, n = 6 mice), and FVB/N mice with tumours from transplant of KP tumour fragments (n = 3 vehicle-treated and n = 5 BAU treated tumour-bearing mice). (D) Surface αM integrin measured as described in (C), for MMTV-PyMT mice treated with vehicle or BAU from palpable tumour (n = 3 mice per experimental group). (E) Fold change in average neutrophil speed, measured by live-cell imaging of PCLS, from tumour-bearing vehicle-treated mice described in (A) followed by ex vivo incubation with αM integrin blocking antibody, M1/70, or isotype control (n = 3 mice per experimental group), matched PCLS are indicated by the adjoining line. Data Information: In (B), lighter dots represent individual neutrophils, darker dots represent mean neutrophil speed per mouse, horizontal line is mean of averages ± SEM. In (C, D), dots represent individual mice, bar graph is mean ± SEM. In (B) one-way ANOVA was performed on the mean speed per mouse, and in (C, D) data were analysed with a one-sample t test to assess whether each experimental group was different to 1, ns = not statistically significant. In (E), paired t test assesses differences between treatment with isotype control and M1/70. Source data are available online for this figure.
Figure 4
Figure 4. UPP1 influences the immune landscape of the pre-metastatic lung.
(A) MMTV-PyMT mice were treated with vehicle (n = 3 mice) or BAU (n = 3 mice) following detection of a palpable tumour, with FVB/N age-matched controls treated with vehicle for matched timepoints (n = 4 mice). Lungs of mice were harvested when one mammary tumour reached 10–12 mm in diameter, and the number of CD8+ T cells assessed by flow cytometry. (B) Lungs of MMTV-PyMT;Upp1+/+ (n = 10 mice) and MMTV-PyMT;Upp1−/− (n = 13 mice) mammary tumour-bearing mice were harvested when one tumour measured 10–15 mm diameter and the number of CD8+ T cells assessed by flow cytometry (n = 5 and n = 7 FVB/N Upp1+/+ and Upp1/− mice as age-matched controls, respectively). (C) Cells were prepared as (B) but with a 3-h incubation with PMA and ionomycin together with Brefeldin A, to enable assessment of intracellular interleukin 2 (IL-2) levels (n = 3 mice per experimental group). (D) CD8+ T cells from the spleen and lymph nodes of FVB/N mice were incubated with equal numbers of neutrophils from the blood of tumour-bearing MMTV-PyMT;Upp1+/+ (n = 6 mice) and MMTV-PyMT;Upp1−/− mice (n = 4 mice) and stimulated to proliferate with CD3/CD28 dynabeads for 48 h. Representative histograms are shown. (E, F) Quantification of (D), as cell proliferation index (E) and total number (F) of CD8+ T cells as assessed by CellTrace staining and flow cytometry (neutrophil preparations from MMTV-PyMT mice;Upp1+/+ (n = 6 mice) and MMTV-PyMT mice;Upp1/ (n = 4 mice)). Data Information: In (AC, E, F), each dot represents an individual mouse, and data are mean ± SEM. In (AC) statistical test used to determine P values is one-way ANOVA (using Kruskal–Wallis test in (C) due to non-normally distributed data, determined by Kolmogorov–Smirnov test), and in (E, F) unpaired t test, ns = not statistically significant. Source data are available online for this figure.
Figure 5
Figure 5. Extracellular uracil increases fibronectin deposition by stromal cells to generate a pro-migratory extracellular matrix.
(A) Fibronectin in the lungs of clinical endpoint MMTV-PyMT;Upp1+/+ and MMTV-PyMT;Upp1/− mice assessed by immunofluorescence. Representative images shown (from a total of n = 8 mice per experimental group), scale bar 200 µm. (B) Quantification of lung fibronectin from (A), each dot represents an individual mouse (n = 8 mice per experimental group). (C) Fibronectin content of cellular-derived matrices made from fibroblasts treated with vehicle, 10 µM or 30 µM uracil quantified using immunofluorescence, data normalised to 0 µM uracil condition (n = 3 biological repeat matrix preparations using one fibroblast cell line). (D) Protrusion length of cells from MMTV-PyMT mammary tumours migrating on cellular-derived matrix determined using time-lapse microscopy. 10 cells were measured per field of view, for 6 positions per well. Each dot represents the mean protrusion length per experiment (n = 3 biological repeat matrix preparations). (E) The recycling of the active confirmation of the β1 integrin was assessed in fibroblasts treated with 10 µM or 30 µM uracil for 24 h (n = 3 biological repeats of the assay). Data Information: In (B), dots represent individual mice, in (CE), dots represent biological replicates. In (BE), data are presented as mean ± SEM. Statistical tests used to calculate P values are: (B) unpaired t test; (C, D) one-way ANOVA; (E) unpaired t tests for each timepoint with the following key: ***P = 0.0007, ****P = 0.0002, **P = 0.0045, ns = not statistically significant. Source data are available online for this figure.
Figure 6
Figure 6. UPP1 influences metastasis in a mouse model of mammary cancer.
(A) Survival of MMTV-PyMT;Upp1+/+ (n = 20 mice) and MMTV-PyMT;Upp1−/ (n = 17 mice), with mice culled at clinical endpoint corresponding to one mammary tumour reached 15 mm in diameter. (B) Lungs of mice from (A) were formalin-fixed and paraffin-embedded (FFPE) and metastatic burden assessed. The proportion of MMTV-PyMT;Upp1+/+ (n = 20 mice) and MMTV-PyMT;Upp1−/ (n = 17 mice) mice with detectable lung metastases is presented. (C) Neutrophils increase expression of Upp1 in response to the presence of a primary tumour. UPP1-high neutrophils secrete uracil into the extracellular microenvironment, and increased extracellular uracil promotes deposition of a fibronectin-rich ECM. UPP1-expressing neutrophils have high cell surface αM integrin, resulting in decreased neutrophil motility in the pre-metastatic lung. Neutrophils accumulate and inhibit T-cell proliferation. Collectively these mechanisms create niches that support metastasis. Data Information: In (A) log-rank (Mantel–Cox) test shows that survival was not significantly different between experimental groups. In (B), statistics are Chi-squared test. Source data are available online for this figure.
Figure EV1
Figure EV1. Primary tumours, diet and age, are not responsible for the UPP1-dependent increases in uracil seen in metastatic cancer.
(A) Serum uracil was assessed by LC–MS in mice FVB/N (n = 5 mice), or mice that were transplanted with KP tumour fragments (tumours grown to 10 mm diameter, n = 4 Upp1+/+ recipient mice, n = 4 Upp1−/− recipient mice). (B) Upp1 was assessed in mammary gland (n = 8 mice), or PyMT+ mammary tumour (n = 31 mice) by RNA-seq. (C) Upp1 was assessed by qRT-PCR in PyMT+ mammary tumours from mice that had 0 (n = 7 mice), 1–10 (n = 16 mice) or >10 (n = 6 mice) metastasis detectable by histological assessment of the lung. (D) Upp1 in MMTV-PyMT tumours was assessed by qPCR and serum uracil in matched mice assessed by LC–MS (n = 29 mice in total, black dots represent mice with no metastasis, and pink and green dots represent mice with 1–10 or >10 metastases, respectively). (E) Upp1 was assessed by RNA-seq from cell lines derived from primary mammary tumours (that were a consequence of fat-pad transplantation of PyMT+ cell lines), or isogenic cells derived from micrometastases that formed in the lung following primary tumour resection (cell line generation and characterisation described in (Gounis et al, 2025) (n = 6 independent cell lines from n = 6 mice). (F, G) FVB/N mice were dosed daily, by oral gavage, with normal water or water containing 10 mM uracil for a total of 4 days. Mice were sacrificed 2 h post dosing on day 4. Uracil was then assessed in the serum (F), or kidney and lung (G) by LC–MS (n = 4 mice per experimental group). (H) Serum uracil in FVB/N mice younger and older than 90 days (n = 3 mice <90 days, and n = 6 mice >90 days old). (I) Age of mice at clinical endpoint presented in relation to the number of lung metastasis per mouse (n = 30 mice). Data Information: In bar graphs, data are presented as mean ± SEM. In (AD, FI) dots represent individual mice. In (E), each dot represents the average of technical triplicate repeats for each cell line. When more than 1 comparison is made (A, C, G) P values were calculated through one-way ANOVA, when 2 experimental groups were compared (B, E, F, H) unpaired t test is used, ns = not statistically significant. For correlation plots, Spearman Correlation statistics are presented.
Figure EV2
Figure EV2. Neutrophils are the significant source of Upp1 in metastatic mammary cancer.
(A) FVB/N mice were dosed intraperitoneal with 0.5 mg/kg lipopolysaccharide (LPS), or vehicle control, and serum uracil measured by LC–MS at defined timepoints post dosing (n = 4 mice per experimental group). (BC) Mice bearing orthotopic PDAC tumours were treated with diphtheria toxin (DT) to ablate myeloid cells, and serum uridine (B) and uracil (C) were assessed after 24 h by LC–MS (n = 6 mice per experimental group). (D) GM-CSF was measured in the serum of FVB/N (n = 4 mice) and MMTV-PyMT tumour-bearing mice (n = 6 mice) by ELISA. (E) Upp1 was assessed by qRT-PCR in BM neutrophils treated ex vivo with vehicle or 20 ng/mL GM-CSF for 24 h (n = 3 mice). (F) Blood neutrophils determined by IDEXX in MMTV-PyMT tumour-bearing mice (n = 11 mice) and 14-week-old FVB/N controls (n = 10 mice). (G) Number of blood neutrophils determined by IDEXX in MMTV-PyMT tumour-bearing mice at clinical endpoint (n = 29 mice), compared to number of lung metastases determined by histological analysis. (H) Intracellular 13C9,15N2-uridine detected by LC–MS in BM neutrophils isolated from female FVB/N Upp1+/+ and Upp1−/− mice, that were incubated for 24 h with 13C9,15N2-uridine (n = 3 mice per experimental group). (I) Blood neutrophils determined by IDEXX and in MMTV-PyMT tumour-bearing mice treated with IgG control (n = 9 mice) or anti-Ly6G (n = 8 mice). (J) The proportion of lung area positive for Ly6G by immunohistochemistry for mice described in I (IgG control n = 9 mice; anti-Ly6G n = 8 mice). Data Information: In bar graphs dots represent individual mice and data are presented as mean ± SEM. When more than 1 comparison was made (A) P values were calculated through one-way ANOVA, when 2 experimental groups are compared (BF, HJ) unpaired t test is used, ns = not statistically significant. For correlation plots (G), Spearman Correlation statistics are presented.
Figure EV3
Figure EV3. The effect of UPP1 on the immune landscape of the lung.
Cell number per gram of lung for CD45+, neutrophils, and CD4+ T cells, assessed by flow cytometry, in the lungs of (A) MMTV-PyMT mice treated with vehicle (n = 3 mice) or BAU (n = 3 mice) from palpable tumour until mammary tumours reached 10–15 mm in diameter, and FVB/N (n = 4 mice) treated with vehicle for time-matched periods. (B) FVB/N mice treated with vehicle (n = 4 mice) or BAU (n = 4 mice) for 12 days. (C) MMTV-PyMT;Upp1+/+ (n = 9 mice) and MMTV-PyMT;Upp1−/− (n = 10 mice) mammary tumour-bearing mice were harvested when one tumour measured 10–15 mm diameter. N = 7 and n = 9 FVB/N Upp1+/+ and Upp1−/− mice were taken as age-matched controls, respectively. Data Information: In all cases, dots represent individual mice and data are presented as mean ± SEM. When more than 1 comparison is made (A, C) P values are calculated through one-way ANOVA, when 2 experimental groups are compared (B) unpaired t test is used, ns = not statistically significant.
Figure EV4
Figure EV4. Understanding T-cell effector function in the absence of Upp1.
(AC) Lungs of MMTV-PyMT;Upp1+/+ and MMTV-PyMT;Upp1−/− tumour-bearing mice were harvested when one tumour measured 10–15 mm diameter. FVB/N age-matched controls were taken in parallel. Cells were prepared as described in the methods for intracellular T-cell staining (n = 3 mice per experimental group). (D) T cells were isolated from FVB/N mice, incubated in culture with CD3/CD28 dynabeads to stimulate proliferation in medium containing 30, 60 and 120 µM uridine or uracil. Proliferation index was calculated compared to the positive control of T cells and vehicle alone stimulated with beads (n = 2 mice). Data Information: In all cases, dots represent individual mice. (AC) Data are mean ± SEM, and P values were calculated by one-way ANOVA. As data in (D) is n = 2, data are presented as mean with datapoints, without error bars and statistics.
Figure EV5
Figure EV5. Understanding the effect of Upp1 and uracil on ECM deposition.
(A) Lung fibronectin was assessed in FVB/N Upp1+/+ (n = 3 mice) and Upp1−/− (n = 5 mice) mice by immunofluorescence, age-matched to those presented in Fig. 5A, B. (B) Fibroblasts were added to rat tail collagen with medium containing 10 µM or 30 µM uracil to make organotypic plugs. Plugs were contracted by fibroblasts for 7 days and stained for fibronectin by immunohistochemistry. Representative images are shown for n = 4 biological repeat experiments, scale bar 100 µm. (C, D) Fibrillar collagen was imaged by second harmonic generation (SHG) microscopy in organotypic plugs contracted by fibroblasts supplemented with 10 or 30 µM uracil. A threshold was applied to the SHG signal and the area of SHG coverage per field of view was determined. The organisation of fibrillar collagen in each field of view was assessed by applying grey level co-occurrence matrix. The mean correlation decay curves from each experimental condition, and the mean of the decay distances derived from those curves, are presented (n = 3 biological repeat experiments colour coded). (EG) RNA-Seq transcript reads from fibroblasts treated with vehicle, 10 µM and 30 µM uracil for 24 h, for fibronectin (Fn1), integrin α5 (Itga5) and integrin β1 (Itgb1) (n = 5 biological repeats for vehicle and 30 µM condition, n = 6 biological repeats for 10 µM uracil). (H) Total protein levels quantified from total cell lysate via ELISA, arbitrary units (AU) (n = 3 biological repeats). (I) Recycling of the total levels of the fibronectin receptor, α5β1 integrin, assessed in fibroblasts treated with 10 µM or 30 µM uracil for 24 h (n = 3 biological repeats). (J) Recycling of transferrin receptor assessed in fibroblasts treated with 10 µM or 30 µM uracil for 24 h (n = 3 biological repeats). Data Information: In all graphs, data are mean ± SEM. In (A) dots represent individual mice. In (C, D), dots are n = 24 fields of view across n = 3 colour coded biological repeat experiments. N = 19 fields of view are represented for mean decay distance as 6 fields of view did not conform to 2 phase decay curves and so could not be fitted in the equation. In (EJ), dots represent biological experiment repeats. When 2 experimental groups are compared (A, C, D, HJ) unpaired t test is used. For (I), *P = 0.0042; **P = 0.0041, ****P = 4.62 × 10−5. For (J), *P = 0.0207; **P = 0.0042; ***P = 0.0025. When more than 1 comparison is made (EG) P values are calculated through one-way ANOVA, ns = not statistically significant.
Figure EV6
Figure EV6. Understanding the effect of Upp1 loss in genetically engineered mouse models of metastatic cancer.
(A) Mammary tumour number and burden in mice MMTV-PyMT;Upp1+/+ (n = 20 mice) and MMTV-PyMT;Upp1−/− (n = 17 mice) at clinical endpoint. (B) Representative H&E stains for the lungs of MMTV-PyMT;Upp1+/+ and MMTV-PyMT;Upp1−/− mice described in (A), scale bar 100 µm. Arrow highlights a metastatic lesion. (C, D) Average number of lung metastases (C) and average lung metastatic burden (D), determined by histological H&E assessment of serial lung sections from MMTV-PyMT;Upp1+/+ (n = 20 mice) and MMTV-PyMT;Upp1−/− (n = 17 mice). (E) Overall survival of KPC:Upp1+/+ (n = 22 mice) and KPC:Upp1−/− mice (n = 33 mice). Mice that were sacrificed due to indications other than PDAC were censored (amounting to n = 7 Upp1+/+ mice and n = 10 Upp1−/− mice). (F) The proportion of mice with metastasis detected by histological H&E assessment of serial sections of liver and lung, KPC:Upp1+/+ (n = 19 mice) and KPC:Upp1−/− (n = 27 mice), and the proportion of mice with microscopic diaphragm metastasis for KPC:Upp1+/+ (n = 18 mice) and KPC:Upp1−/− mice (n = 21 mice). (G) Local invasion was determined for KPC:Upp1+/+ (n = 22) and KPC:Upp1−/− (n = 32) mice. Inconclusive annotation refers to samples that were unclear at necropsy as to whether full invasion had occurred. (H) Representative image of local invasion that was scored at necropsy, namely the attachment and invasion of the primary PDAC to other organs within the abdominal cavity. Example shown is from a KPC:Upp1+/+ mouse, with PDAC invading intestinal tissue, scale bar 200 µm. Data Information: In (A, C, D) dots represent individual mice, data are presented as mean ± SEM, and P values were calculated by unpaired t test, ns = not statistically significant. In (E), log-rank (Mantel–Cox) test P = 0.5926. In (F, G), P values calculated by chi-squared test.

References

    1. Aarts CEM, Hiemstra IH, Tool ATJ, van den Berg TK, Mul E, van Bruggen R, Kuijpers TW (2019) Neutrophils as suppressors of T cell proliferation: does age matter? Front Immunol 10:2144 - PMC - PubMed
    1. Adams KJ, Pratt B, Bose N, Dubois LG, St John-Williams L, Perrott KM, Ky K, Kapahi P, Sharma V, MacCoss MJ et al (2020) Skyline for small molecules: a unifying software package for quantitative metabolomics. J Proteome Res 19:1447–1458 - PMC - PubMed
    1. Alshetaiwi H, Pervolarakis N, McIntyre LL, Ma D, Nguyen Q, Rath JA, Nee K, Hernandez G, Evans K, Torosian L et al (2020) Defining the emergence of myeloid-derived suppressor cells in breast cancer using single-cell transcriptomics. Sci Immunol 5:eaay6017, https://www.ncbi.nlm.nih.gov/geo/query/acc.cgi?acc=GSE139125 [DATASET] - PMC - PubMed
    1. Attalla S, Taifour T, Bui T, Muller W (2021) Insights from transgenic mouse models of PyMT-induced breast cancer: recapitulating human breast cancer progression in vivo. Oncogene 40:475–491 - PMC - PubMed
    1. Barnes TA, Amir E (2017) HYPE or HOPE: the prognostic value of infiltrating immune cells in cancer. Br J Cancer 117:451–460 - PMC - PubMed

MeSH terms

LinkOut - more resources