

Exploring affordable and effective pandemic containment measures in lower-income countries with a spatial SEIR model: a case study in South Africa
- PMID: 40702473
- PMCID: PMC12285115
- DOI: 10.1186/s12889-025-23686-0
Exploring affordable and effective pandemic containment measures in lower-income countries with a spatial SEIR model: a case study in South Africa
Abstract
Background: The COVID-19 pandemic has exposed the vulnerabilities of lower-income countries due to limited healthcare infrastructure and socioeconomic constraints, highlighting the need for effective containment measures that minimize socioeconomic costs and prepare for future pandemics alike, which are expected to become more frequent. Although prior studies have examined various strategies in these regions, a significant gap remains in quantitative research on affordable measures to combat the highly transmissible SARS-CoV-2 Omicron variant, which greatly challenges effective measures for previous strains. Studies on targeted containment measures for Omicron have dramatically declined even in higher-income regions, and their findings could be much less applicable in lower-income regions due to substantial socioeconomic disparities.
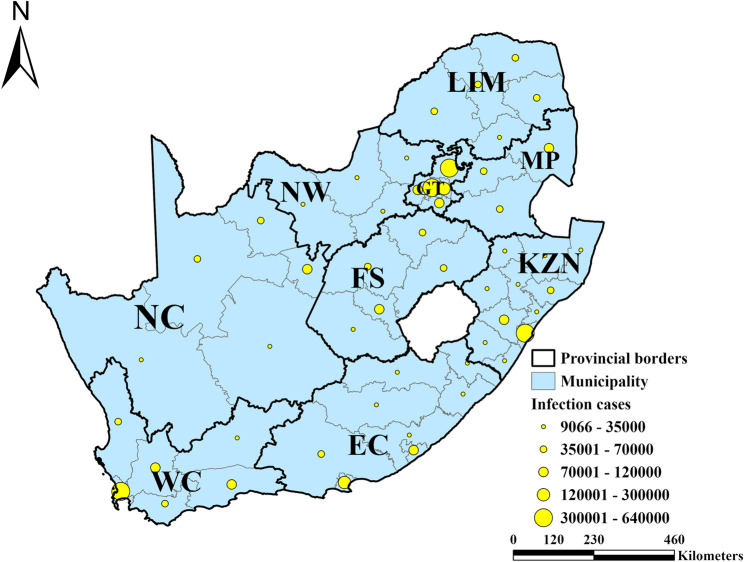
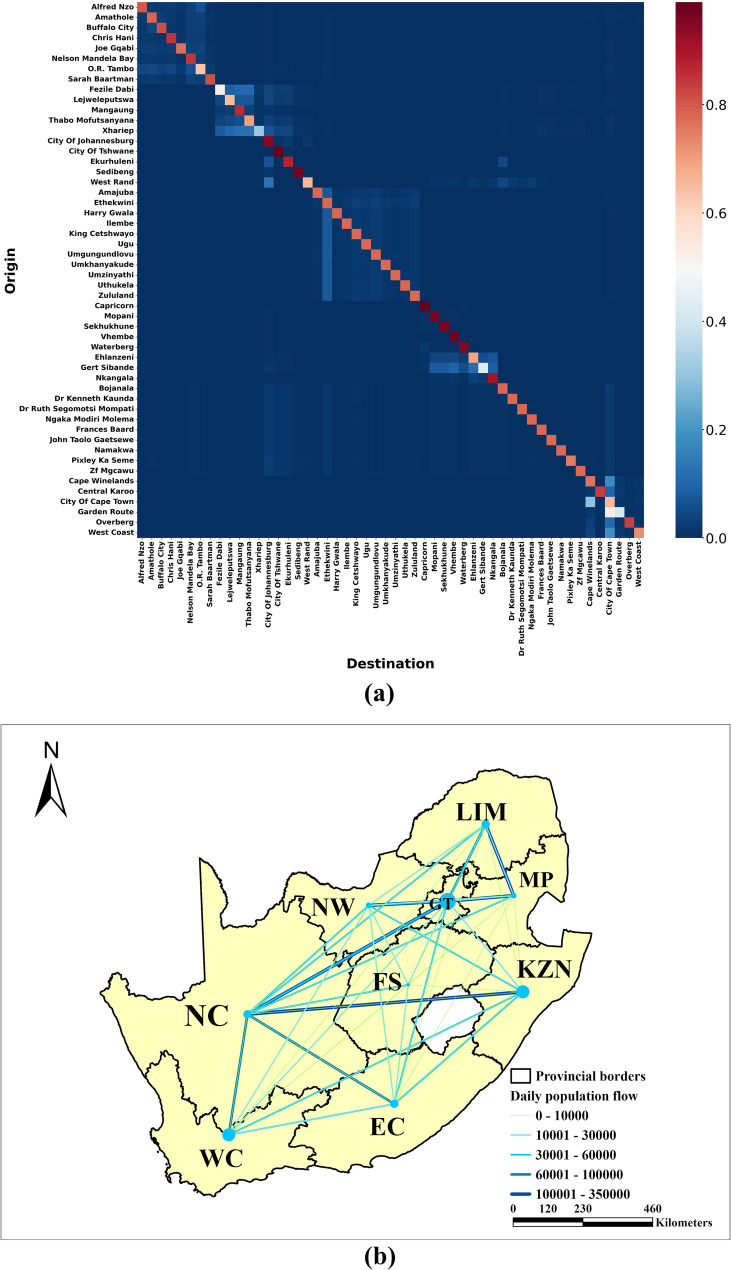
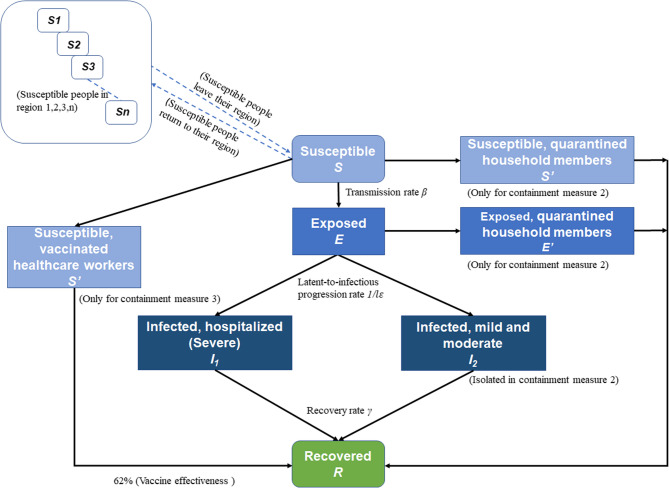
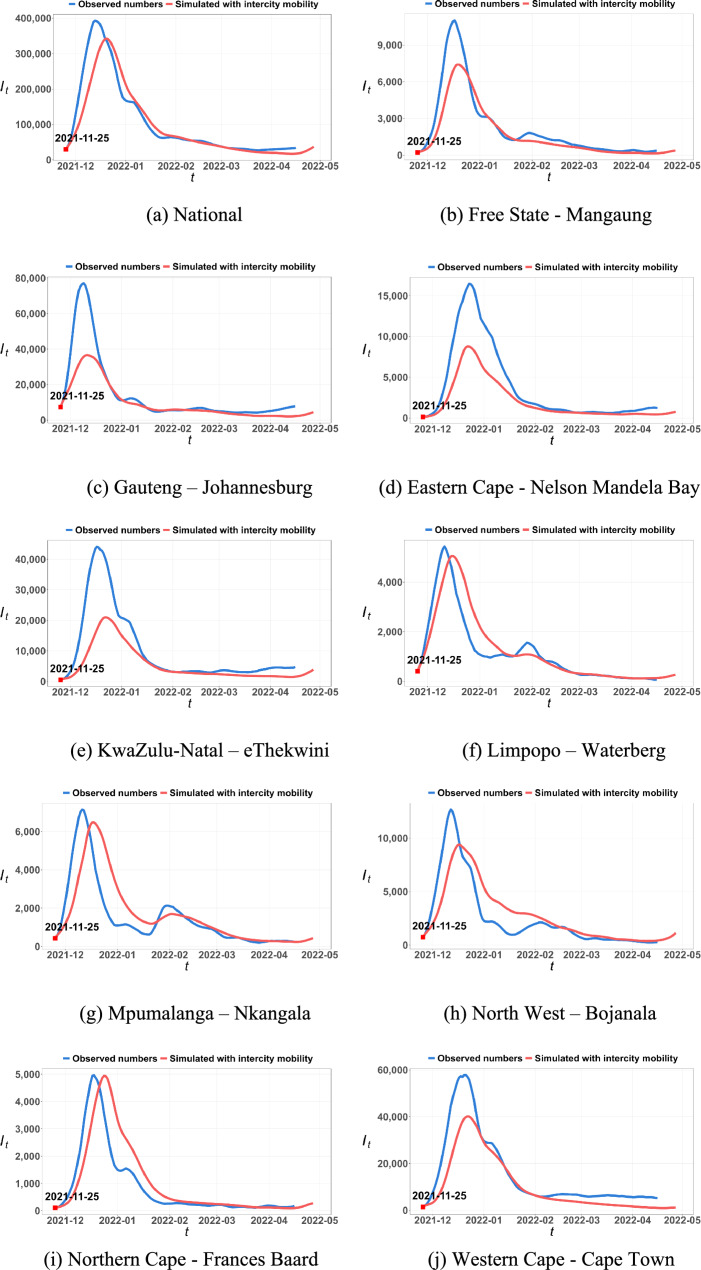
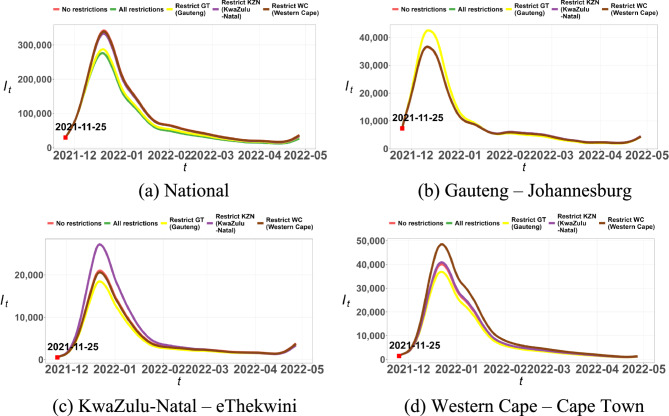
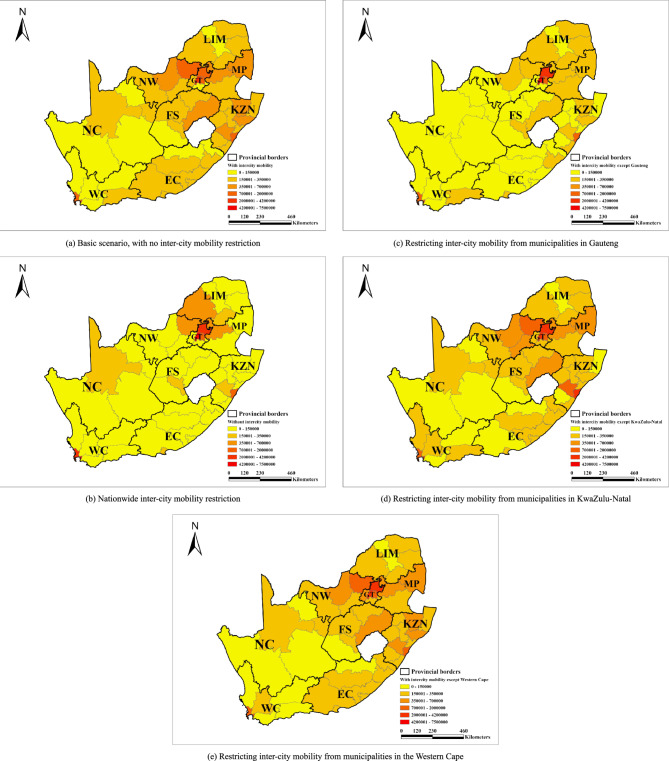
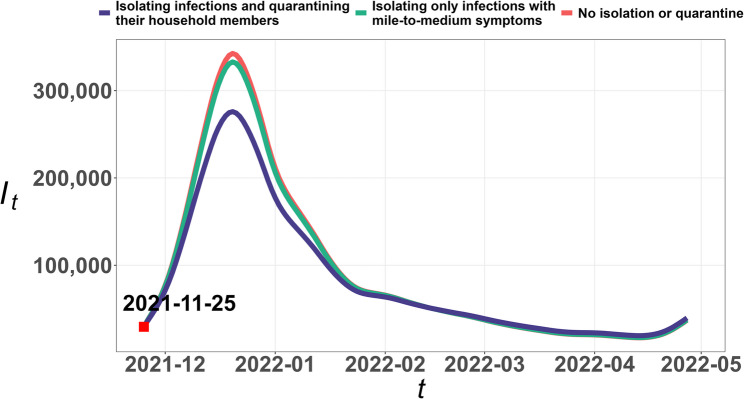
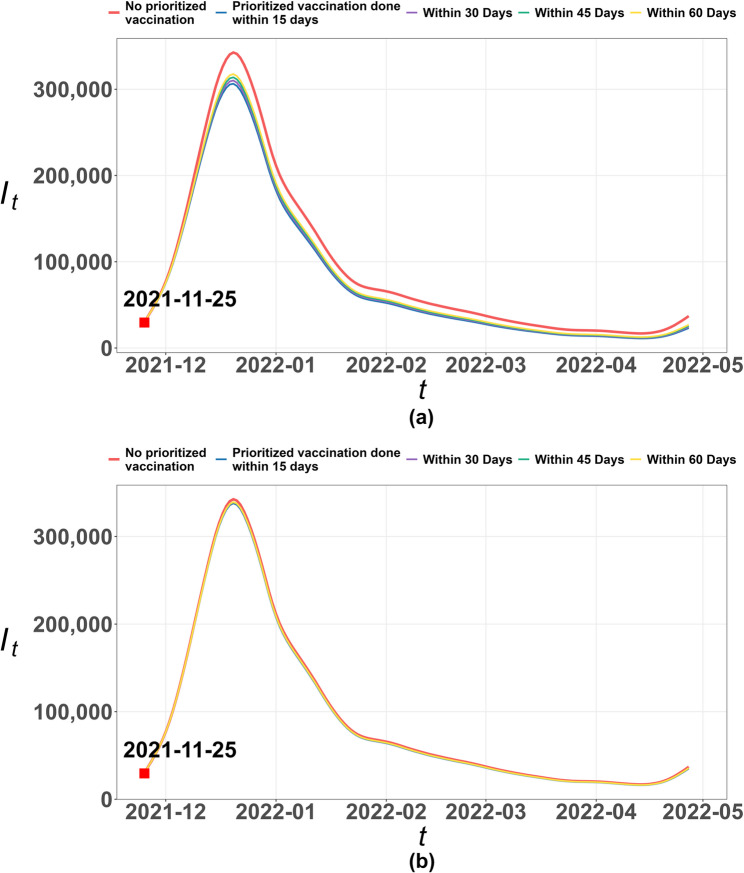
Methods: This study addresses this gap by focusing on South Africa. A spatial Susceptible-Exposed-Infected-Recovered (SEIR) model was developed to simulate the virus spread during the country's first Omicron wave from November 2021 to April 2022, integrating multisource statistics to overcome the typical scarcity of inter-city mobility data in lower-income countries. Three affordable containment measures were examined: (1) restricting inter-city mobility in epicenter provinces, while allowing nationwide intra-city movement for livelihood activities; (2) home isolation for positive cases, alongside quarantine for co-residents, accounting for high rates of asymptomatic cases, underreporting, and delays of self-isolation; and (3) prioritizing booster vaccinations for high-risk healthcare workers.
Results: The findings indicate that restricting inter-city mobility in the epicenter Gauteng, which only accounted for 3.6% of national mobility, could reduce national infections by 15.0%. Quarantining households with positive cases could reduce infections by 10.9%, despite the high rates of asymptomatic cases and presymptomatic transmission. Prioritizing booster vaccinations was also effective when healthcare workers had a much higher infection risk than others. Meanwhile, these measures incurred minimal socioeconomic costs compared to earlier pandemic strategies. Additionally, the spatial variation of containment measure effectiveness suggests that timely implementation of these measures before the infection rate escalates is critical for ensuring their effectiveness.
Conclusions: This research provides essential insights for lower-income countries to manage current and future pandemics within their economic and healthcare constraints, especially regarding targeted mobility restriction, quarantine, prioritized vaccination, and timing of containment measures.
Keywords: Affordable containment measures; Home quarantine; Lower-income countries; Mobility restriction; SARS-COV-2 Omicron variant.
© 2025. The Author(s).
Conflict of interest statement
Declarations. Ethics approval and consent to participate: Not applicable. Consent for publication: Not applicable. Competing interests: The authors declare no competing interests.
Figures
Similar articles
-
Physical interventions to interrupt or reduce the spread of respiratory viruses.Cochrane Database Syst Rev. 2023 Jan 30;1(1):CD006207. doi: 10.1002/14651858.CD006207.pub6. Cochrane Database Syst Rev. 2023. PMID: 36715243 Free PMC article.
-
Non-pharmacological measures implemented in the setting of long-term care facilities to prevent SARS-CoV-2 infections and their consequences: a rapid review.Cochrane Database Syst Rev. 2021 Sep 15;9(9):CD015085. doi: 10.1002/14651858.CD015085.pub2. Cochrane Database Syst Rev. 2021. PMID: 34523727 Free PMC article.
-
Measures implemented in the school setting to contain the COVID-19 pandemic.Cochrane Database Syst Rev. 2022 Jan 17;1(1):CD015029. doi: 10.1002/14651858.CD015029. Cochrane Database Syst Rev. 2022. Update in: Cochrane Database Syst Rev. 2024 May 2;5:CD015029. doi: 10.1002/14651858.CD015029.pub2. PMID: 35037252 Free PMC article. Updated.
-
Technology-enabled CONTACT tracing in care homes in the COVID-19 pandemic: the CONTACT non-randomised mixed-methods feasibility study.Health Technol Assess. 2025 May;29(24):1-24. doi: 10.3310/UHDN6497. Health Technol Assess. 2025. PMID: 40350743 Free PMC article.
-
The effect of sample site and collection procedure on identification of SARS-CoV-2 infection.Cochrane Database Syst Rev. 2024 Dec 16;12(12):CD014780. doi: 10.1002/14651858.CD014780. Cochrane Database Syst Rev. 2024. PMID: 39679851 Free PMC article.
References
-
- Jassat W, et al. Long COVID in low-income and middle-income countries: the hidden public health crisis. Lancet. 2023;402(10408):1115–7. - PubMed
MeSH terms
Grants and funding
LinkOut - more resources
Full Text Sources
Medical
Miscellaneous
