. 2025 Jul 23;21(1):24.
doi: 10.1186/s12993-025-00291-0.

Role of astrocytic mu-opioid receptors of the ventrolateral periaqueductal gray in modulating anxiety-like responses

Affiliations

Role of astrocytic mu-opioid receptors of the ventrolateral periaqueductal gray in modulating anxiety-like responses

Yinan Du et al. Behav Brain Funct. .

Abstract

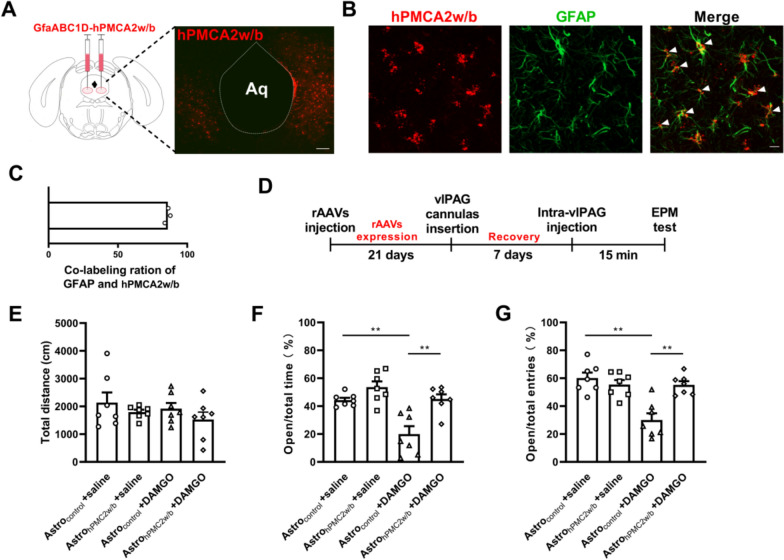
Background: Mu-opioid receptors (MORs) are critical regulators mediating the modulation of several behavioral reactions, including analgesia, addiction, and sedation. Recent studies have reported that MORs are closely associated with mood disorders or anxiety behaviors; however, the underlying neural mechanisms remain unclear. The periaqueductal gray (PAG), a key brain area, participates in the modulation of aversive emotional behaviors. MORs show a high expression in the ventrolateral PAG (vlPAG) region. This study explored the preliminary role of MORs expressed in the vlPAG in modulating emotional behaviors.

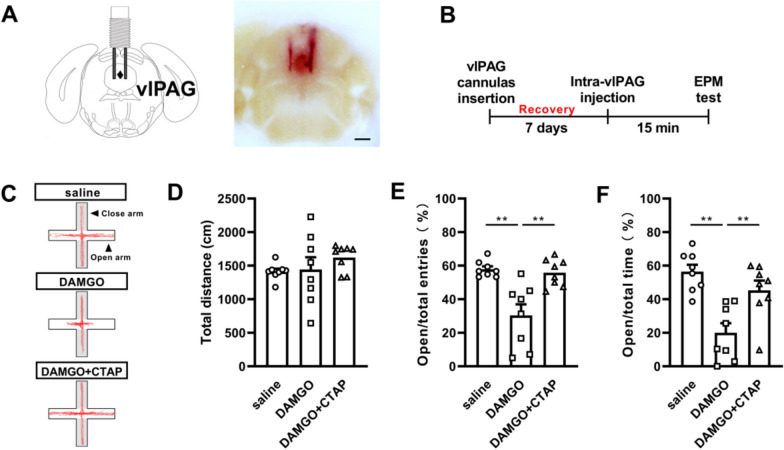
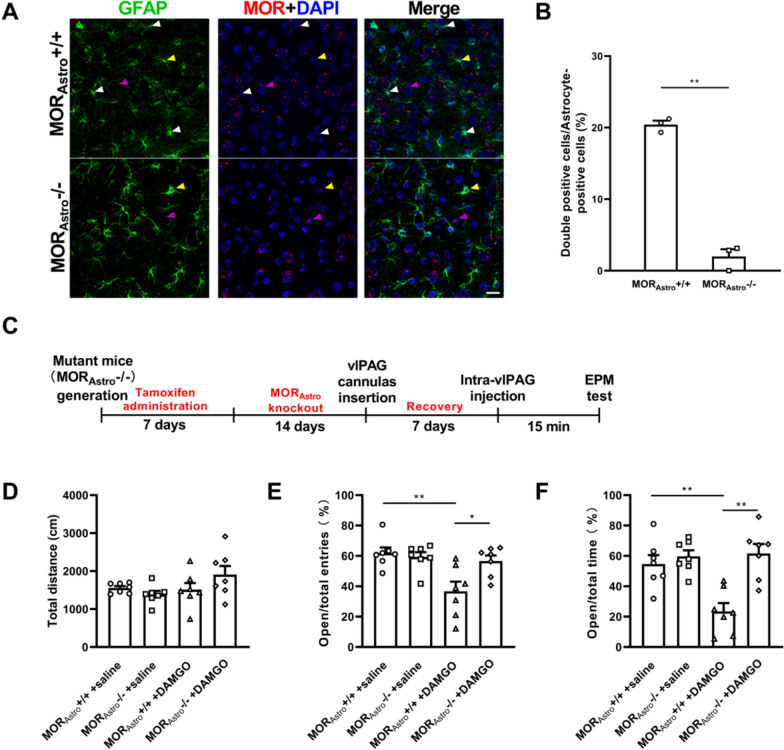
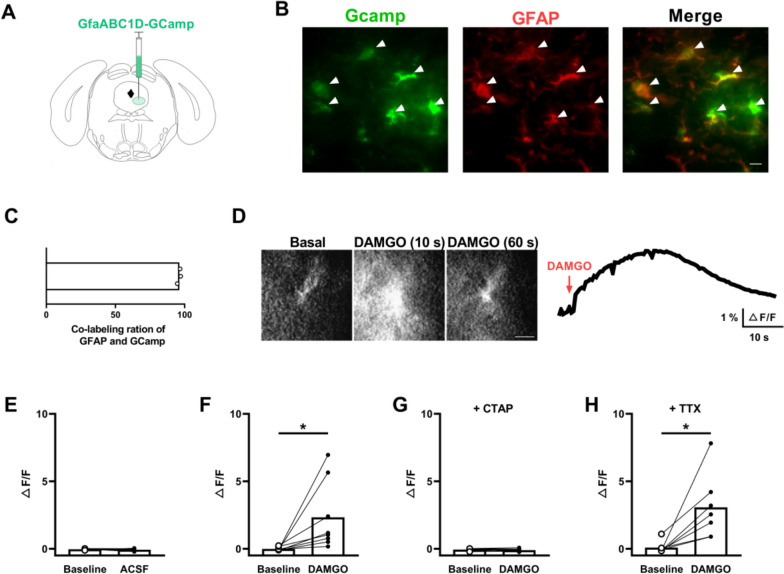
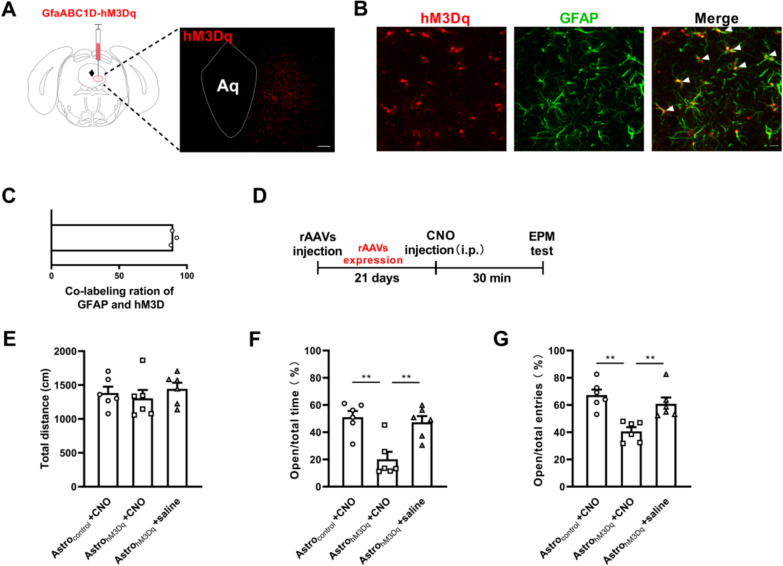
Results: Bilateral administration of DAMGO, an MOR-specific agonist, into the vlPAG of male mice elicited anxiety-like behaviors in elevated plus maze tests. This phenotype was reversed by conditional knockdown of astrocytic MORs. In contrast, glutamatergic or GABAergic MORs were not involved in vlPAG MOR-dependent anxiety-like behaviors. By using in vitro calcium imaging of vlPAG astrocytes and chemical genetic technologies, we found that vlPAG astrocytic MORs can promote astrocytic calcium signaling, which can efficiently induce anxiety-like behaviors. Accordingly, the interference of astrocytic calcium signaling by viral infection reversed vlPAG-dependent anxiety-like behaviors.

Conclusion: Our findings demonstrated that vlPAG astrocytic, but not glutamatergic or GABAergic, MORs are involved in modulating emotional reactions, and these effects are accomplished by MOR-elicited astrocytic calcium signaling mechanisms. The present study provides a theoretical basis for treating emotional dysfunctions during MOR-targeted management.

Keywords: Anxiety; Astrocyte; Calcium signaling; Mu-opioid receptors; Periaqueductal gray.


Conflict of interest statement

Declarations. Ethics approval and consent to participate: All animal experiments were carried out by following the guidelines of the Chinese Council on Animal Care. The study protocol was approved by the Animal Protection Committee of Shaanxi Normal University and the Animal Care Committee of The First Affiliated Hospital of Xi'an Medical University. Competing interests: The authors declare no competing interests.

Figures

Fig. 1
Fig. 1
Activation of ventrolateral periaqueductal gray (vlPAG) mu-opioid receptors (MORs) elicited anxiety-like behavior. A Schematic showing the implantation and morphological confirmation of the guide cannulas in the vlPAG. Scale bar: 400 μm. B Experimental schedule. C Typical representative activity tracking in EPM tests. Summary plots of the total distance (D), percentage of open arm entries (E), and percentage of time spent in the open arms (F) during EPM tests. Saline-treated mice: n = 8; DAMGO-treated mice: n = 8; DAMGO+CTAP-treated mice: n = 8. Total distance: ordinary one-way ANOVA measures, F(2,21) = 0.9410, p = 0.4061. Percentage of open arm entries: ordinary one-way ANOVA followed by Sidak’s multiple comparison test measures, F(2,21) = 12.85, p = 0.0002 (**), saline vs. DAMGO, p = 0.0005 (**); saline vs. DAMGO + CTAP, p = 0.9358; DAMGO vs. DAMGO + CTAP, p = 0.0011 (**). Percentage of time spent in the open arms: ordinary one-way ANOVA followed by Sidak’s multiple comparison test measures, F(2,21) = 12.53, p = 0.0003 (**), saline vs. DAMGO, p = 0.0002 (**); saline vs. DAMGO + CTAP, p = 0.3128; DAMGO vs. DAMGO + CTAP, p = 0.0075 (**)
Fig. 2
Fig. 2
MORAstro are involved in vlPAG-MOR-elicited anxiety-like behavior. A Schematic of in situ hybridization for Oprm1 mRNA and immunofluorescence for the GFAP protein in the vlPAG areas in MORAstro−/− and MORAstro+/+ mice. The nucleus is stained in blue (DAPI), GFAP is stained in green, and Oprm1 mRNA is stained in red. Scale bar: 10 μm. The white arrowheads indicate cells double-labeled with Oprm1 mRNA and GFAP; the purple arrowheads represent Oprm1 mRNA localization in GFAP-negative cells; and the yellow arrowheads represent GFAP-positive cells without Oprm1 mRNA. B Quantitative analysis of the percentage of double-positive cells (Oprm1 and GFAP) against GFAP-positive cells. t4 = 16.01, p < 0.0001, unpaired Student’s t test, n = 3 mice per group. C Schematic showing the timeline of the experimental procedures. Summary plots of the total distance (D), percentage of open arm entries (E), and percentage of time spent in the open arms (F) during EPM tests. MORAstro+/+ + saline-treated mice: n = 7; MORAstro−/− + saline-treated mice: n = 7; MORAstro+/+ + DAMGO-treated mice: n = 7; MORAstro−/− + DAMGO-treated mice: n = 7. Total distance: ordinary one-way ANOVA measures, F(3,24) = 2.177, p = 0.1169. Percentage of open arm entries: ordinary one-way ANOVA followed by Sidak’s multiple comparison test measures, F(3,24) = 6.856, p = 0.0017 (**), MORAstro+/+ + saline vs. MORAstro+/+ + DAMGO, p = 0.0027 (**); MORAstro−/− + saline vs. MORAstro−/− + DAMGO, p = 0.9988; MORAstro+/+ + DAMGO vs. MORAstro−/− + DAMGO, p = 0.0221 (*). Percentage of time spent in the open arms: ordinary one-way ANOVA followed by Sidak’s multiple comparison test measures, F(3,24) = 10.69, p = 0.0001 (**), MORAstro+/+ + saline vs. MORAstro+/+ + DAMGO, p = 0.0028 (**); MORAstro−/− + saline vs. MORAstro−/− + DAMGO, p = 0.9999; MORAstro+/+ + DAMGO vs. MORAstro−/− + DAMGO, p = 0.0003 (**)
Fig. 3
Fig. 3
MORGABA are not involved in vlPAG-MOR-elicited anxiety-like behavior. A Schematic of in situ hybridization for Oprm1 mRNA and GAT mRNA in the vlPAG areas in MORGABA−/− and MORGABA+/+ mice. The nucleus is stained in blue (DAPI), GAT is stained in green, and Oprm1 mRNA is stained in red. Scale bar: 10 μm. The white arrowheads indicate cells double-labeled with Oprm1 mRNA and GAT mRNA; the purple arrowheads represent Oprm1 mRNA localization in GAT-negative cells; and the yellow arrowheads represent GAT-positive cells without Oprm1 mRNA. B Quantitative analysis of the percentage of double-positive cells (Oprm1 and GAT) against GAT-positive cells. t4 = 37.73, p < 0.0001, unpaired Student’s t test, n = 3 mice per group. C Schematic showing the timeline of the experimental procedures. Summary plots of total distance (D), percentage of open arm entries (E), and percentage of time spent in the open arms (F) during EPM tests. MORGABA+/+ + saline-treated mice: n = 7; MORGABA−/− + saline-treated mice: n = 7; MORGABA+/+ + DAMGO-treated mice: n = 7; MORGABA−/− + DAMGO-treated mice: n = 7. Total distance: ordinary one-way ANOVA measures, F(3,24) = 1.399, p = 0.2675. Percentage of open arm entries: ordinary one-way ANOVA followed by Sidak’s multiple comparison test measures, F(3,24) = 9.688, p = 0.0002 (**), MORGABA+/+ + saline vs. MORGABA+/+ + DAMGO, p = 0.0012 (**); MORGABA−/− + saline vs. MORGABA−/− + DAMGO, p = 0.0345(*); MORGABA+/+ + DAMGO vs. MORGABA−/− + DAMGO, p = 0.9999. Percentage of time spent in the open arms: ordinary one-way ANOVA followed by Sidak’s multiple comparison test measures, F(3,24) = 23.57, p < 0.0001 (**), MORGABA+/+ + saline vs. MORGABA+/+ + DAMGO, p = 0.0001 (**); MORGABA−/− + saline vs. MORGABA−/− + DAMGO, p < 0.0001 (**); MORGABA+/+ + DAMGO vs. MORGABA−/− + DAMGO, p = 0.8229
Fig. 4
Fig. 4
MORGlut are not involved in vlPAG-MOR-elicited anxiety-like behavior. A Schematic of in situ hybridization for Oprm1 mRNA and Glut mRNA in the vlPAG areas in MORGlut−/− and MORGlut+/+ mice. The nucleus is stained in blue (DAPI), Glut is stained in green, and Oprm1 mRNA is stained in red. Scale bar: 10 μm. The white arrowheads indicate cells double-labeled with Oprm1 mRNA and Glut mRNA; the purple arrowheads represent Oprm1 mRNA localization in Glut-negative cells; and the yellow arrowheads represent Glut-positive cells without Oprm1 mRNA. B Quantitative analysis of the percentage of double-positive cells (Oprm1 and Glut) against Glut-positive cells. t4 = 28.29, p < 0.0001, unpaired Student’s t test, n = 3 mice per group. C Schematic showing the timeline of the experimental procedures. Summary plots of the total distance (D), percentage of open arm entries (E), and percentage of time spent in the open arms (F) during EPM tests. MORGlut+/+ + saline-treated mice: n = 7; MORGlut−/− + saline-treated mice: n = 7; MORGlut+/+ + DAMGO-treated mice: n = 7; MORGlut−/− + DAMGO-treated mice: n = 7. Total distance: ordinary one-way ANOVA measures, F(3,24) = 1.985, p = 0.1432. Percentage of open arm entries: ordinary one-way ANOVA followed by Sidak’s multiple comparison test measures, F(3,24) = 12.77, p < 0.0001 (**), MORGlut+/+ + saline vs. MORGlut+/+ + DAMGO, p = 0.0001 (**); MORGlut−/− + saline vs. MORGlut−/− + DAMGO, p = 0.0355(*); MORGlut+/+ + DAMGO vs. MORGlut−/− + DAMGO, p = 0.2730. Percentage of time spent in the open arms: ordinary one-way ANOVA followed by Sidak’s multiple-comparison test measures, F(3,24) = 24.90, p < 0.0001 (**), MORGlut+/+ + saline vs. MORGlut+/+ + DAMGO, p = 0.0001 (**); MORGlut−/− + saline vs. MORGlut−/− + DAMGO, p < 0.0001 (**); MORGlut+/+ + DAMGO vs. MORGlut−/−  + DAMGO, p = 0.9475
Fig. 5
Fig. 5
Activation of PAG MORAstro triggers astrocytic calcium signaling. A Schematic of the rAAVs monitored to specifically exhibit astrocytic calcium levels in the vlPAG. B Double-immunofluorescence staining of GCamp (green) with GFAP (red). Scale bar: 10 μm. The white arrows represent the co-labeled cells. C Statistics of the co-labeling rate of GCamp coupled with GFAP (n = 3 mice). D Typical change and representative traces of Ca2+signals of a single PAG astrocyte during DAMGO (1 μM) perfusion (arrow indicates DAMGO application). Summary bar graph of the change in the ΔF/F of the regions of interest during treatment with ACSF (E) (t7 = 0.8204, p = 0.4353, paired Student’s t test, n = 8 cells from n = 2 mice), 1 μM DAMGO (F) (t7 = 2.565, p = 0.0373 (*), paired Student’s t test, n = 8 cells from n = 2 mice), 1 μM DAMGO + 10 μM CTAP (G) (t7 = 0.9734, p = 0.3628, paired Student’s t test, n = 8 cells from n = 2 mice), and 1 μM DAMGO + 1 μM TTX (H) (t6 = 3.297, p = 0.0165 (*), paired Student’s t test, n = 7 cells from n = 2 mice) perfusion
Fig. 6
Fig. 6
Direct activation of vlPAG astrocytic calcium signaling elicits anxiety-like behavior. A Schematic and fluorescent signal image of the rAAVs engineered to specifically activate vlPAG astrocytic calcium signaling. Aq: Aqueduct. Scale bar: 100 μm. B Double-immunofluorescence staining of hM3Dq (red) with GFAP (green). Scale bar: 10 μm. The white arrows represent the co-labeled cells. C Statistics of the co-labeling rate of hM3Dq coupled with GFAP (n = 3 mice). D Schematic showing the timeline of the experimental procedures. i.p. means intraperitoneal injection. Summary plots of the total distance (E), percentage of open arm entries (F), and percentage of time spent in the open arms (G) during EPM tests. Astrocontrol + CNO-treated mice: n = 6; AstrohM3Dq + CNO-treated mice: n = 6; AstrohM3Dq + saline-treated mice: n = 6. Total distance: ordinary one-way ANOVA measures, F(2,15) = 0.4609, p = 0.6393. Percentage of open arm entries: ordinary one-way ANOVA followed by Sidak’s multiple comparison test measures, F(2,15) = 12.04, p = 0.0008 (**), Astrocontrol + CNO vs. AstrohM3Dq + CNO, p = 0.0008 (**); AstrohM3Dq + CNO vs. AstrohM3Dq + saline, p = 0.0084 (**); Astrocontrol + CNO vs. AstrohM3Dq + saline, p = 0.6171. Percentage of time spent in open arms: ordinary one-way ANOVA followed by Sidak’s multiple comparison test measures, F(2,15) = 11.91, p = 0.0013 (**), Astrocontrol + CNO vs. AstrohM3Dq + CNO, p = 0.0013 (**); AstrohM3Dq + CNO vs. AstrohM3Dq + saline, p = 0.0040 (**); Astrocontrol + CNO vs. AstrohM3Dq + saline, p = 0.9323
Fig. 7
Fig. 7
Astrocytic calcium signaling is the cellular mechanism underlying vlPAG MORAstro-dependent anxiety-like behavior. A Schematic and fluorescent signal image of the rAAVs engineered to specifically extrude cytoplasmic calcium and reduce calcium oscillations in vlPAG astrocytes. Aq: Aqueduct. B Double-immunofluorescence staining of hPMCA2w/b (red) with GFAP (green). Scale bar: 10 μm. C Statistics of the co-labeling rate of hPMCA2w/b coupled with GFAP (n = 3 mice). D Schematic showing the timeline of the experimental procedures. Summary plots of the total distance (E), percentage of open arm entries (F), and percentage of time spent in the open arms (G) during EPM tests. Astrocontrol + saline-treated mice: n = 7; AstrohPMCA2w/b + saline-treated mice: n = 7; Astrocontrol + DAMGO-treated mice: n = 7; AstrohPMCA2w/b + DAMGO-treated mice: n = 7. Total distance: ordinary one-way ANOVA measures, F(3,24) = 1.007, p = 0.4068. Percentage of open arm entries: ordinary one-way ANOVA followed by Sidak’s multiple comparison test measures, F(3,24) = 13.21, p < 0.0001 (**), Astrocontrol + saline vs. Astrocontrol + DAMGO, p < 0.0001 (**); AstrohPMCA2w/b + saline vs. AstrohPMCA2w/b + DAMGO, p = 0.9999; Astrocontrol + DAMGO vs. AstrohPMCA2w/b + DAMGO, p = 0.0005 (**). Percentage of time spent in the open arms: ordinary one-way ANOVA followed by Sidak’s multiple comparison test measures, F(3,24) = 13.35, p < 0.0001 (**), Astrocontrol + saline vs. Astrocontrol + DAMGO, p = 0.0013 (**); AstrohPMCA2w/b + saline vs. AstrohPMCA2w/b + DAMGO, p = 0.6004; Astrocontrol + DAMGO vs. AstrohPMCA2w/b + DAMGO, p = 0.0009 (**)

References

    1. Cuitavi J, Torres-Pérez JV, Lorente JD, Campos-Jurado Y, Andrés-Herrera P, Polache A, et al. Crosstalk between mu-opioid receptors and neuroinflammation: consequences for drug addiction and pain. Neurosci Biobehav Rev. 2023;145: 105011. - PubMed
    1. Corder G, Castro DC, Bruchas MR, Scherrer G. Endogenous and exogenous opioids in pain. Annu Rev Neurosci. 2018;41:453–73. - PMC - PubMed
    1. Nummenmaa L, Karjalainen T, Isojärvi J, Kantonen T, Tuisku J, Kaasinen V, et al. Lowered endogenous mu-opioid receptor availability in subclinical depression and anxiety. Neuropsychopharmacology. 2020;45(11):1953–9. - PMC - PubMed
    1. Rogers AH, Kauffman BY, Bakhshaie J, McHugh RK, Ditre JW, Zvolensky MJ. Anxiety sensitivity and opioid misuse among opioid-using adults with chronic pain. Am J Drug Alcohol Abuse. 2019;45(5):470–8. - PMC - PubMed
    1. Rogers AH, Garey L, Raines AM, Allan NP, Schmidt NB, Zvolensky MJ. Anxiety sensitivity and opioid use motives among adults with chronic low back pain. Exp Clin Psychopharmacol. 2022;30(1):23–30. - PubMed

MeSH terms

Substances