Low-temperature H2S detection using Fe-doped SnO2/rGO nanocomposite sensor
- PMID: 40703081
- PMCID: PMC12284769
- DOI: 10.1039/d5ra01664a
Low-temperature H2S detection using Fe-doped SnO2/rGO nanocomposite sensor
Abstract
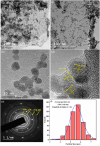
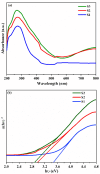
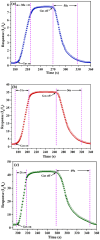
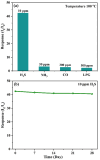
A low-temperature H2S gas sensor was designed using 3% Fe-doped SnO2/rGO nanocomposite as the sensing material. Fe-doped SnO2 quantum dots (QDs) were prepared using a sol-gel combustion method, subsequently leading to the formation of the Fe-SnO2/rGO nanocomposite through a simple sonication process. To evaluate the performance of the sensor material, the sample underwent comprehensive characterization using XRD, FE-SEM, HRTEM, Raman shift, XPS and BET surface area analysis based on nitrogen (N2) adsorption-desorption. The XRD pattern HR-TEM confirmed the formation of a well-defined tetragonal crystal phase of SnO2, indicating high structural integrity. Meanwhile, the BET analysis revealed a specific surface area of 72.7 m2 g-1 with pore size of 7.83 nm. Morphological analysis (HR-TEM) revealed that 3% Fe-doped SnO2 QDs was uniformly dispersed on the rGO surface, with an average particle size of 5.6 nm. Gas sensing performance of pristine SnO2 (S1), 3% Fe-doped SnO2 QDs (S2), and 3% Fe-SnO2/rGO (S3) nanocomposite based sensors was evaluated at operating temperatures ranging from 25 °C to 175 °C. Incorporation of rGO significantly enhanced the sensitivity of the 3% Fe-doped SnO2/rGO nanocomposite towards H2S compared to pristine SnO2 and 3% Fe-SnO2 QDs. The 3% Fe-SnO2/rGO (S3) based sensor demonstrated a significant response of about 42.4 to 10 ppm H2S at a low operating temperature of 100 °C, with a rapid response time of 21 seconds. It also exhibited excellent selectivity for H2S against interfering gases such as NH3, LPG, and CO. The enhanced sensitivity and selectivity are attributed to the synergistic interaction between 3% Fe-SnO2 and rGO. A possible gas sensing mechanism underlying the improved performance of the nanocomposite is discussed.
This journal is © The Royal Society of Chemistry.
Conflict of interest statement
The author declares no competing interests.
Figures


References
-
- Chou C. H. and Selene J., World Health Organization and International Programme on Chemical Safety, Hydrogen Sulfide: Human Health Aspects, World Health Organization, 2003
LinkOut - more resources
Full Text Sources

