. 2025 May 22:15:1-17.
doi: 10.1016/j.ncrna.2025.05.013. eCollection 2025 Dec.

LncRNA MIR155HG suppresses cell apoptosis by activating autophagy via miR-7036b-3p/GPNMB axis and AMPK/mTOR signaling in spinal cord injury

Affiliations

LncRNA MIR155HG suppresses cell apoptosis by activating autophagy via miR-7036b-3p/GPNMB axis and AMPK/mTOR signaling in spinal cord injury

Ruoxi Liu et al. Noncoding RNA Res. .

Abstract

Background: Long non-coding RNAs (lncRNAs) participate in spinal cord injury (SCI) development through regulating autophagy and neuronal apoptosis. Previously, MIR155HG was identified as an upregulated lncRNA in rat bladder tissues harvested after SCI operation. Our study aimed to elucidate the function of MIR155HG in SCI.

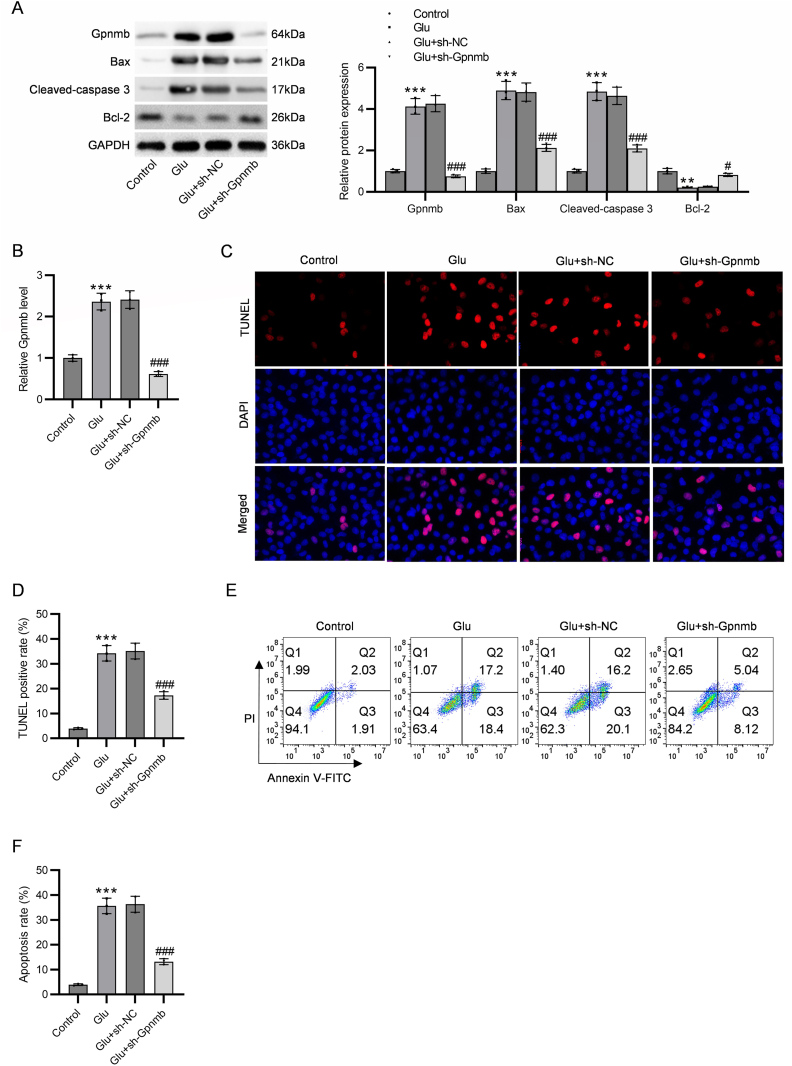
Methods: Glutamate (Glu)-stimulated primary mouse spinal cord neurons were used as SCI cellular models. Contusion-induced SCI mouse models were established using an improved weightlessness method. Neuronal apoptosis and autophagy affected by MIR155HG or GPNMB silencing were assessed by TUNEL staining, flow cytometry assay, western blotting, and immunofluorescence staining. The binding of miR-7036b-3p on MIR155HG (or GPNMB) was verified by luciferase reporter assay. Histological changes were observed through HE and Masson staining.

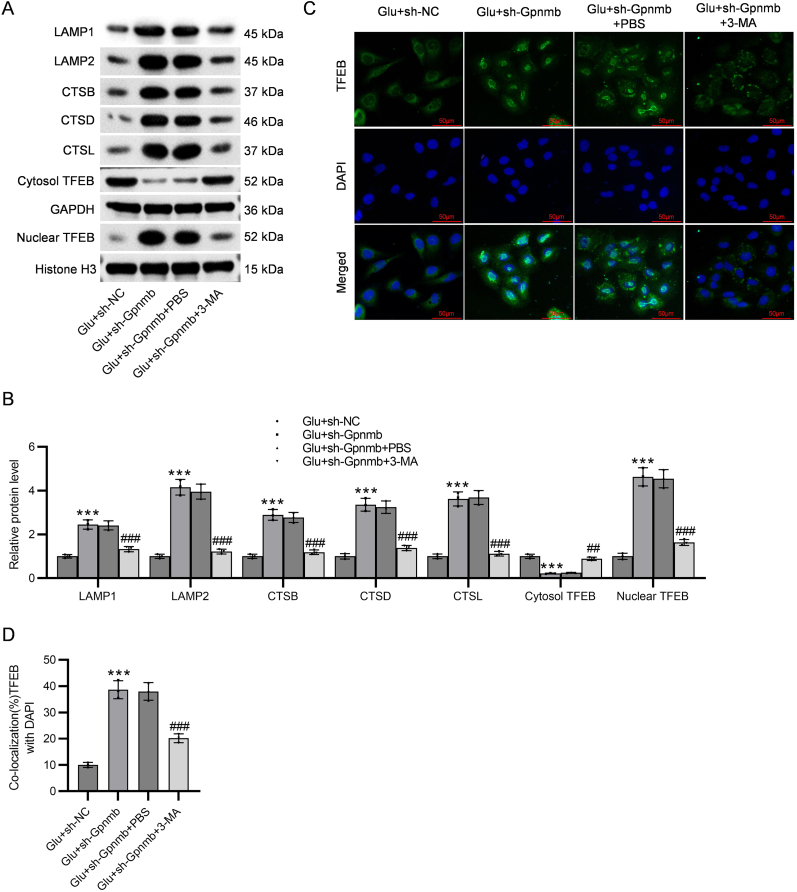
Results: MIR155HG and GPNMB expression was elevated while miR-7036b-3p expression was reduced in SCI. MIR155HG silencing attenuated the apoptosis in Glu-stimulated neurons and ameliorated glial scar formation and motor function of SCI mice. GPNMB knockdown mitigated apoptosis, enhanced autophagy, activated AMPK phosphorylation, and repressed mTOR phosphorylation. MIR155HG upregulated GPNMB expression by sponging miR-7036b-3p. The autophagy inhibitor 3-MA reversed the above changes caused by GPNMB depletion.

Conclusion: MIR155HG knockdown alleviated neuronal apoptosis by enhancing autophagy in SCI via miR-7036b-3p/GPNMB axis and AMPK/mTOR pathway.

Keywords: AMPK/mTOR; Apoptosis; Autophagy; GPNMB; MIR155HG; Spinal cord injury.


Conflict of interest statement

The authors declare that they have no known competing financial interests or personal relationships that could have appeared to influence the work reported in this paper.

Figures

Image 1
Graphical abstract
Fig. 1
Fig. 1
Silencing of GPNMB inhibits neuronal apoptosis in vitro. The primary spinal cord neurons were first treated with glutamate (Glu; 100 μM) for 24 h and then transfected with sh-NC or sh-GPNMB. (A) The levels of GPNMB and apoptosis-related proteins (Bax, Bcl-2, caspase-3, and cleaved caspase-3) in neurons were examined by western blotting. The protein bands were presented, and the relative protein levels were quantified after normalization to GAPDH. (B) RT-qPCR analysis of GPNMB mRNA level in neurons. (C) Representative images showing TUNEL-stained (red) apoptotic neurons. Cell nuclei were counterstained by DAPI (blue). (D) Quantification of the percentage of TUNEL-positive cells (apoptotic cells) in each group. (E) Flow cytometry analysis following Annexin V-FITC/PI double staining of neurons was adopted to measure cell apoptosis. (F) Quantification of apoptotic neurons according to the results of flow cytometry. n = 3. ∗∗p < 0.01, ∗∗∗p < 0.001 vs. Con; #p < 0.05, ###p < 0.001 vs. Glu + sh-NC.
Fig. 2
Fig. 2
Knockdown of GPNMB activates autophagy and regulates the AMPK/mTOR pathway in neurons. The primary spinal cord neurons were first treated with glutamate (Glu; 100 μM) for 24 h and then transfected with sh-NC or sh-GPNMB. (A) Representative images showing the formation of autophagosomes (green) which were labeled by Cyto-ID Autophagy Detection dye. (B) Quantification of the fluorescence intensities of Cyto-ID-stained cells. (C) Measurement of autophagy-related proteins (LC3B II/LC3B I, Beclin-1, and p62), AMPK, p-AMPK, mTOR, and p-mTOR proteins in neurons by western blotting. The protein bands were displayed and the relative protein levels were quantified. n = 3. ∗p < 0.05, ∗∗∗p < 0.001 vs. Con; #p < 0.05, ###p < 0.001 vs. Glu + sh-NC.
Fig. 3
Fig. 3
Silencing of MIR155HG suppresses neuronal apoptosis in vitro. The primary spinal cord neurons were first treated with glutamate (Glu; 100 μM) for 24 h and then transfected with sh-NC or sh-MIR155HG. (A) RT-qPCR analysis of MIR155HG mRNA level in neurons. (B) Representative images showing TUNEL-stained (red) apoptotic neurons. Cell nuclei were counterstained by DAPI (blue). (C) Quantification of the percentage of TUNEL-positive cells (apoptotic cells) in each group. (D) Cell apoptosis was determined by Annexin V-FITC/PI double staining followed by flow cytometry analysis. (E) Quantification of apoptotic neurons based on the results of flow cytometry. (F) The levels of apoptosis-related proteins (Bax, Bcl-2, caspase-3, and cleaved caspase-3) in neurons were tested through western blotting. The protein bands were presented, and the relative protein levels were normalized after normalization to GAPDH. n = 3. ∗∗∗p < 0.001 vs. Con; #p < 0.05, ###p < 0.001 vs. Glu + sh-NC.
Fig. 4
Fig. 4
MIR155HG targets GPNMB by sponging miR-7036b-3p. (A) Venn diagram showing the overlapped miRNAs between MIR155HG downstream candidate miRNAs and GPNMB upstream candidate miRNAs predicted by using miRDB software. (B) Detection of miR-7036b-3p mRNA level in control and Glu-treated neurons by RT-qPCR. (C–D) Determination of miR-7036b-3p mRNA level in MIR155HG-silenced or miR-7036b-3p-overexpressed neurons by RT-qPCR. (E–F) Measurement of GPNMB mRNA and protein levels in neurons after downregulating MIR155HG or overexpressing miR-7036b-3p by RT-qPCR and western blotting. (G) Verification of the binding capacities between miR-7036b-3p and MIR155HG (or GPNMB) in neurons by luciferase reporter assay. n = 3. ∗∗p < 0.01, ∗∗∗p < 0.001.
Fig. 5
Fig. 5
The autophagy inhibitor 3-MA antagonized the alleviation of GPNMB silencing on neuronal apoptosis. The primary spinal cord neurons were pretreated with 3-MA (10 mM), followed by glutamate (Glu; 100 μM) treatment and sh-NC or sh-GPNMB transfection. (A) Representative images showing TUNEL-stained (red) apoptotic neurons. Cell nuclei were counterstained by DAPI (blue). (B) Quantification of the percentage of TUNEL-positive cells. (C) Flow cytometry analysis after Annexin V-FITC/PI double staining of neurons was utilized to measure cell apoptosis. (D) Quantification of apoptotic neurons according to the results of flow cytometry. (E) The levels of apoptosis-related proteins in neurons were determined through western blotting. The protein bands were illustrated. (F) Quantification of relative protein levels after normalization to GAPDH. ∗∗∗p < 0.001 vs. Glu + sh-NC; ###p < 0.001 vs. Glu + sh-GPNMB + PBS.
Fig. 6
Fig. 6
The autophagy inhibitor 3-MA abrogated the activation of GPNMB silencing on autophagy and the AMPK/mTOR pathway in neurons. The primary spinal cord neurons were pretreated with 3-MA (10 mM), followed by glutamate (Glu; 100 μM) treatment and sh-NC or sh-GPNMB transfection. (A) Evaluation of autophagy-related proteins (LC3B II/LC3B I, Beclin-1, and p62), AMPK, p-AMPK, mTOR, and p-mTOR proteins in neurons via western blotting. The protein bands were shown. (B) Quantification of relative protein levels. n = 3. ∗∗p < 0.01, ∗∗∗p < 0.001 vs. Glu + sh-NC; #p < 0.05, ##p < 0.01, ###p < 0.001 vs. Glu + sh-GPNMB + PBS.
Fig. 7
Fig. 7
GPNMB silencing stimulates lysosome biogenesis by inducing TFEB translocation in neurons. The primary spinal cord neurons were pretreated with 3-MA (10 mM), followed by glutamate (Glu; 100 μM) treatment and sh-NC or sh-GPNMB transfection. (A–B) Determination of LAMP1, LAMP2, CTSB, CTSD, CTSL, cytosol TFEB, and nuclear TFEB protein levels in neurons through western blotting. (C–D) Representative images of immunofluorescence staining showing TFEB nuclear translocation in neurons and quantification of the colocalization of TFEB and DAPI. n = 3. ∗∗∗p < 0.001 vs. Glu + sh-NC; ##p < 0.01, ###p < 0.001 vs. Glu + sh-GPNMB + PBS.
Fig. 8
Fig. 8
MIR155HG targets GPNMB by sponging miR-7036b-3p in SCI mouse models. (A–C) Assessment of MIR155HG, miR-7036b-3p, and GPNMB expression in spinal cord tissues of sham mice, SCI mice, and SCI mice intrathecally injected with sh-NC or sh-MIR155HG by RT-qPCR. n = 10. (D–F) Analysis of the relationship among MIR155HG, miR-7036b-3p, and GPNMB expression in spinal cord tissues of SCI mice through Pearson's correlation tests. n = 30. ∗p < 0.05 vs. Sham; #p < 0.05 vs. SCI + sh-NC.
Fig. 9
Fig. 9
MIR155HG knockdown exerts a neuroprotective effect on SCI mouse models. (A) Representative images of HE and Masson staining presenting the formation of glial scars at the lesion site in mice after SCI surgery and sh-MIR155HG intrathecal injection. (B) Assessment of the neurological function of the mice by Basso, Beattie, and Bresnahan (BBB) scoring at different times after SCI induction. n = 10. ∗p < 0.05 vs. Sham; #p < 0.05 vs. SCI + sh-NC.
Fig. 10
Fig. 10
GPNMB knockdown represses cell apoptosis in spinal cord tissues of SCI mice. (A) Representative images of TUNEL staining showing apoptotic cells in the spinal cord tissues of mice. Cell nuclei were counterstained with DAPI. (B) Quantification of the percentage of TUNEL-positive cells (apoptotic cells) in each group. (C) The levels of apoptosis-related proteins in the spinal cord tissues of mice were examined by western blotting. The protein bands were presented, and the relative protein levels were quantified after normalization to GAPDH. n = 10. ∗∗∗p < 0.05 vs. Sham; ###p < 0.05 vs. SCI + sh-NC.
Fig. 11
Fig. 11
GPNMB depletion activates autophagy in SCI mice. (A–B) Representative images of immunofluorescence staining showing Beclin-1 and LC3 expression in mouse spinal cord tissues. (C) The levels of autophagy-related proteins, AMPK, p-AMPK, mTOR, p-mTOR, LAMP1, CTSD, cytosol TFEB, and nuclear TFEB proteins in mouse spinal cord tissues were measured by western blotting. The protein bands were displayed and the relative protein levels were quantified. n = 10. ∗∗∗p < 0.001 vs. Sham; ###p < 0.001 vs. SCI + sh-NC.

Similar articles

References

    1. Anjum A., et al. Spinal cord injury: pathophysiology, multimolecular interactions, and underlying recovery mechanisms. Int. J. Mol. Sci. 2020;21(20) - PMC - PubMed
    1. Stein D.M., Knight W.A.t. Emergency neurological Life support: traumatic spine injury. Neurocritical Care. 2017;27(Suppl 1):170–180. - PubMed
    1. Kumar R., et al. Traumatic spinal injury: global epidemiology and worldwide volume. World Neurosurg. 2018;113:e345–e363. - PubMed
    1. Li H.T., et al. Exendin-4 enhances motor function recovery via promotion of autophagy and inhibition of neuronal apoptosis after spinal cord injury in rats. Mol. Neurobiol. 2016;53(6):4073–4082. - PubMed
    1. Li J., et al. Neuroprotective effects of oxymatrine via triggering autophagy and inhibiting apoptosis following spinal cord injury in rats. Mol. Neurobiol. 2023;60(8):4450–4471. - PubMed

LinkOut - more resources